bayesnec standard ggplot2
plotting method.
# S3 method for bayesmanecfit
autoplot(
  object,
  ...,
  nec = TRUE,
  ecx = FALSE,
  force_x = FALSE,
  xform = NA,
  all_models = FALSE,
  plot = TRUE,
  ask = TRUE,
  newpage = TRUE,
  multi_facet = TRUE
)
Arguments
- object
An object of class
bayesmanecfitas returned by functionbnec.- ...
Additional arguments to be passed to
ggbnec_data.- nec
Should NEC values be added to the plot? Defaults to TRUE.
- ecx
Should ECx values be added to the plot? Defaults to FALSE.
- force_x
A
logicalvalue indicating if the argumentxformshould be forced on the predictor values. This is useful when the user transforms the predictor beforehand (e.g. when using a non-standard base function).- xform
A function to apply to the returned estimated concentration values.
- all_models
Should all individual models be plotted separately\ (defaults to FALSE) or should model averaged predictions be plotted instead?
- plot
Should output
ggplotoutput be plotted? Only relevant ifall = TRUEandmulti_facet = FALSE.- ask
Indicates if the user is prompted before a new page is plotted. Only relevant if
plot = TRUEandmulti_facet = FALSE.- newpage
Indicates if the first set of plots should be plotted to a new page. Only relevant if
plot = TRUEandmulti_facet = FALSE.- multi_facet
Should all plots be plotted in one single panel via facets? Defaults to TRUE.
Value
A ggplot object.
See also
Other autoplot methods:
autoplot.bayesnecfit()
Examples
# \donttest{
library(brms)
library(bayesnec)
options(mc.cores = 2)
data(nec_data)
necs <- bnec(y ~ crf(x, c("nec3param", "nec4param")), data = nec_data,
iter = 2e2, family = Beta(link = "identity"))
#> Finding initial values which allow the response to be fitted using a nec3param model and a beta distribution.
#> Compiling Stan program...
#> Start sampling
#> Warning: Bulk Effective Samples Size (ESS) is too low, indicating posterior means and medians may be unreliable.
#> Running the chains for more iterations may help. See
#> https://mc-stan.org/misc/warnings.html#bulk-ess
#> Warning: Tail Effective Samples Size (ESS) is too low, indicating posterior variances and tail quantiles may be unreliable.
#> Running the chains for more iterations may help. See
#> https://mc-stan.org/misc/warnings.html#tail-ess
#> Response variable modelled as a nec3param model using a beta distribution.
#> Finding initial values which allow the response to be fitted using a nec4param model and a beta distribution.
#> Compiling Stan program...
#> Start sampling
#> Warning: There were 25 transitions after warmup that exceeded the maximum treedepth. Increase max_treedepth above 10. See
#> https://mc-stan.org/misc/warnings.html#maximum-treedepth-exceeded
#> Warning: Examine the pairs() plot to diagnose sampling problems
#> Warning: The largest R-hat is 1.94, indicating chains have not mixed.
#> Running the chains for more iterations may help. See
#> https://mc-stan.org/misc/warnings.html#r-hat
#> Warning: Bulk Effective Samples Size (ESS) is too low, indicating posterior means and medians may be unreliable.
#> Running the chains for more iterations may help. See
#> https://mc-stan.org/misc/warnings.html#bulk-ess
#> Warning: Tail Effective Samples Size (ESS) is too low, indicating posterior variances and tail quantiles may be unreliable.
#> Running the chains for more iterations may help. See
#> https://mc-stan.org/misc/warnings.html#tail-ess
#> Response variable modelled as a nec4param model using a beta distribution.
#> Fitted models are: nec3param nec4param
#> Warning: Found 1 observations with a pareto_k > 0.7 in model 'nec3param'. It is recommended to set 'moment_match = TRUE' in order to perform moment matching for problematic observations.
#> Warning:
#> 3 (3.0%) p_waic estimates greater than 0.4. We recommend trying loo instead.
#> Warning: Found 5 observations with a pareto_k > 0.7 in model 'nec4param'. It is recommended to set 'moment_match = TRUE' in order to perform moment matching for problematic observations.
#> Warning:
#> 16 (16.0%) p_waic estimates greater than 0.4. We recommend trying loo instead.
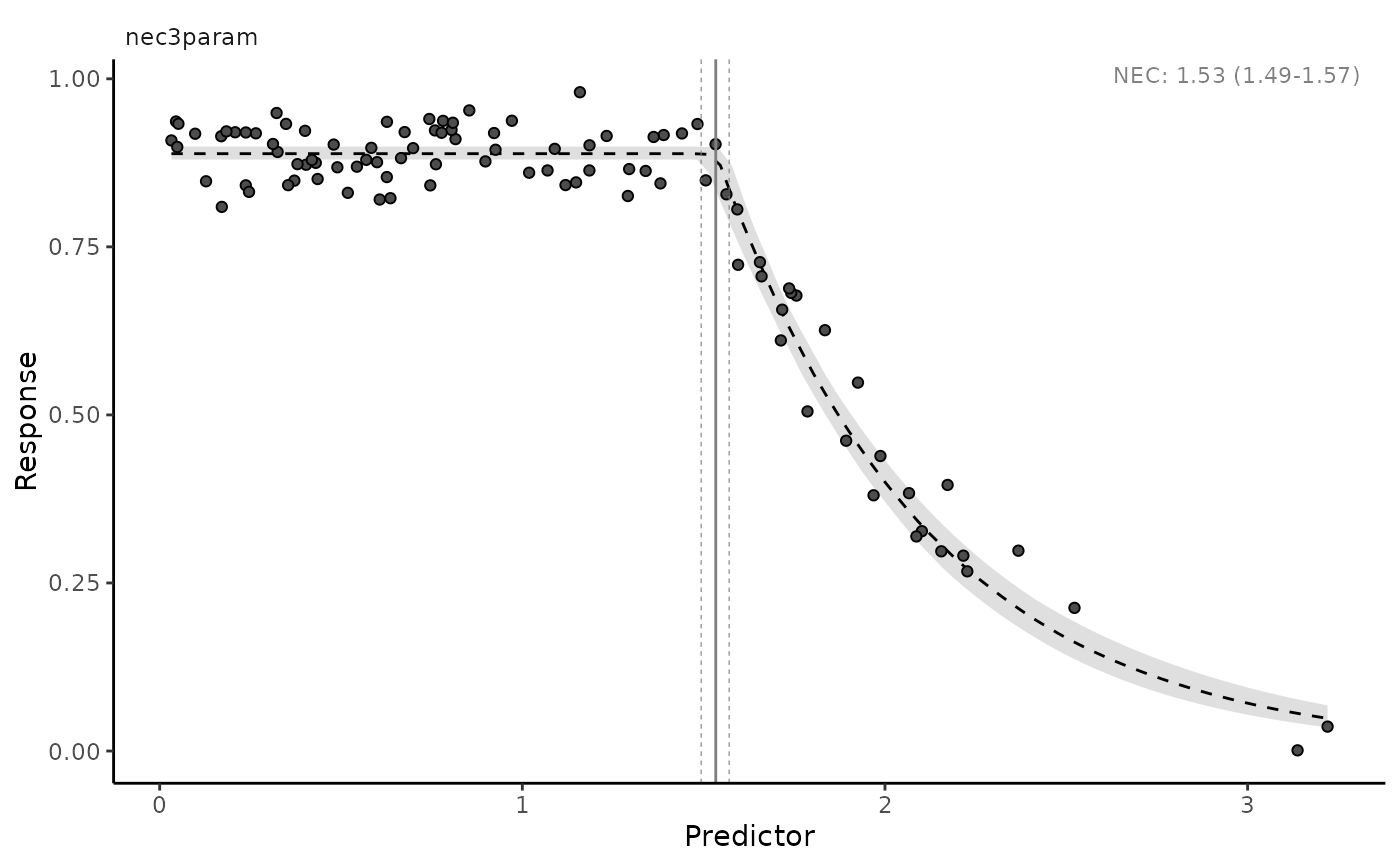
nec3param <- pull_out(necs, "nec3param")
#> Pulling out model(s): nec3param
autoplot(nec3param)
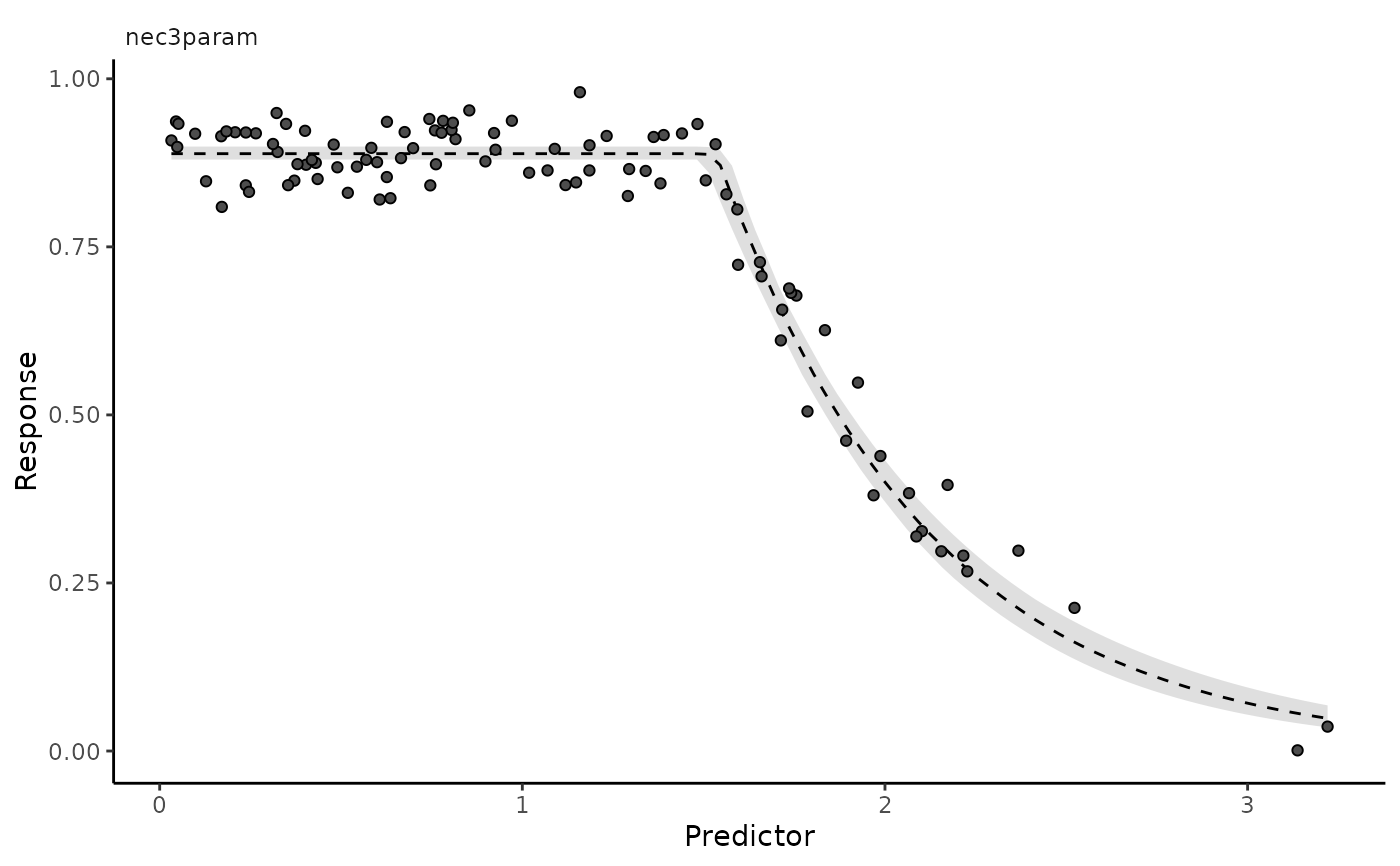
 autoplot(nec3param, nec = FALSE)
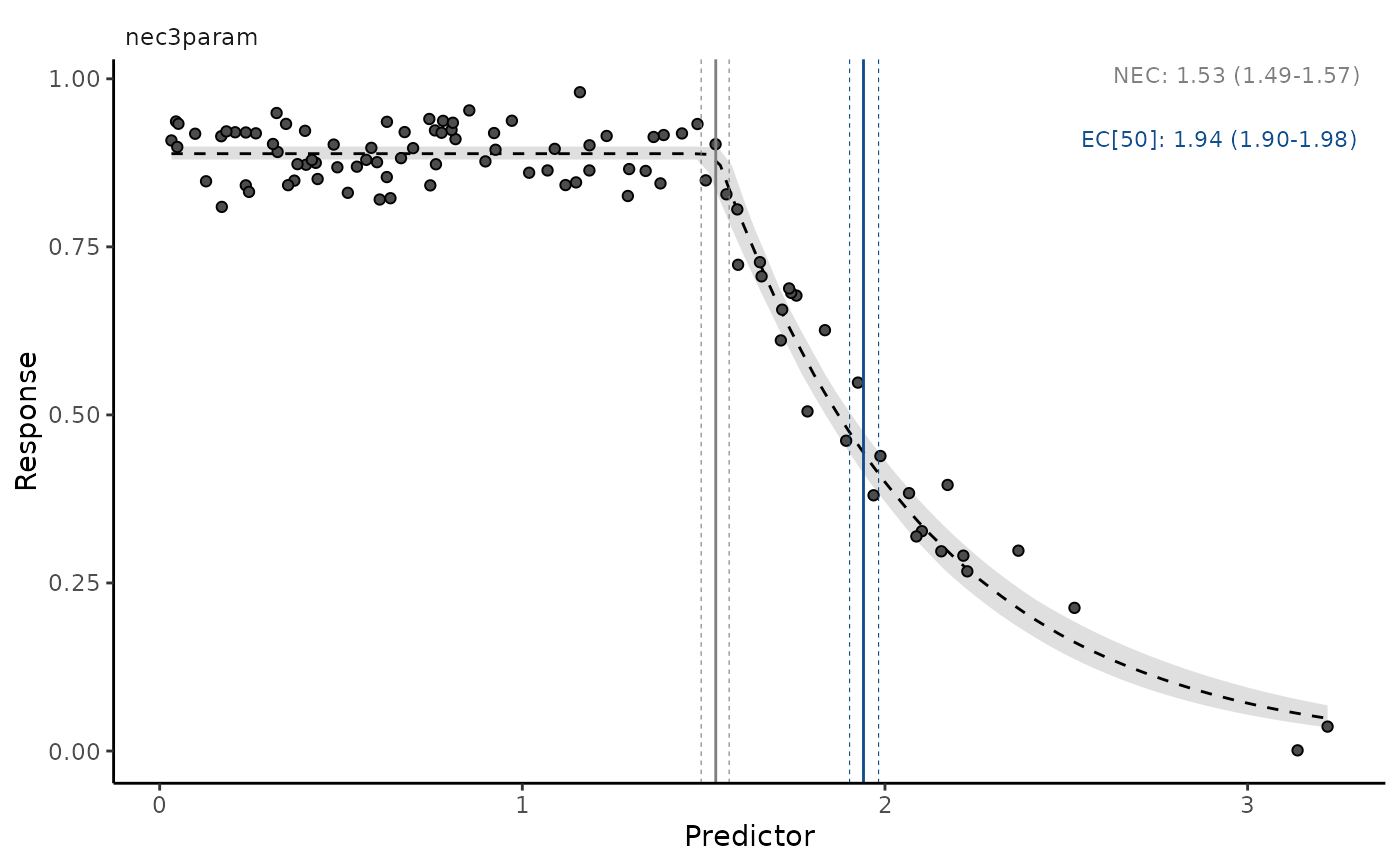
 autoplot(nec3param, ecx = TRUE, ecx_val = 50)
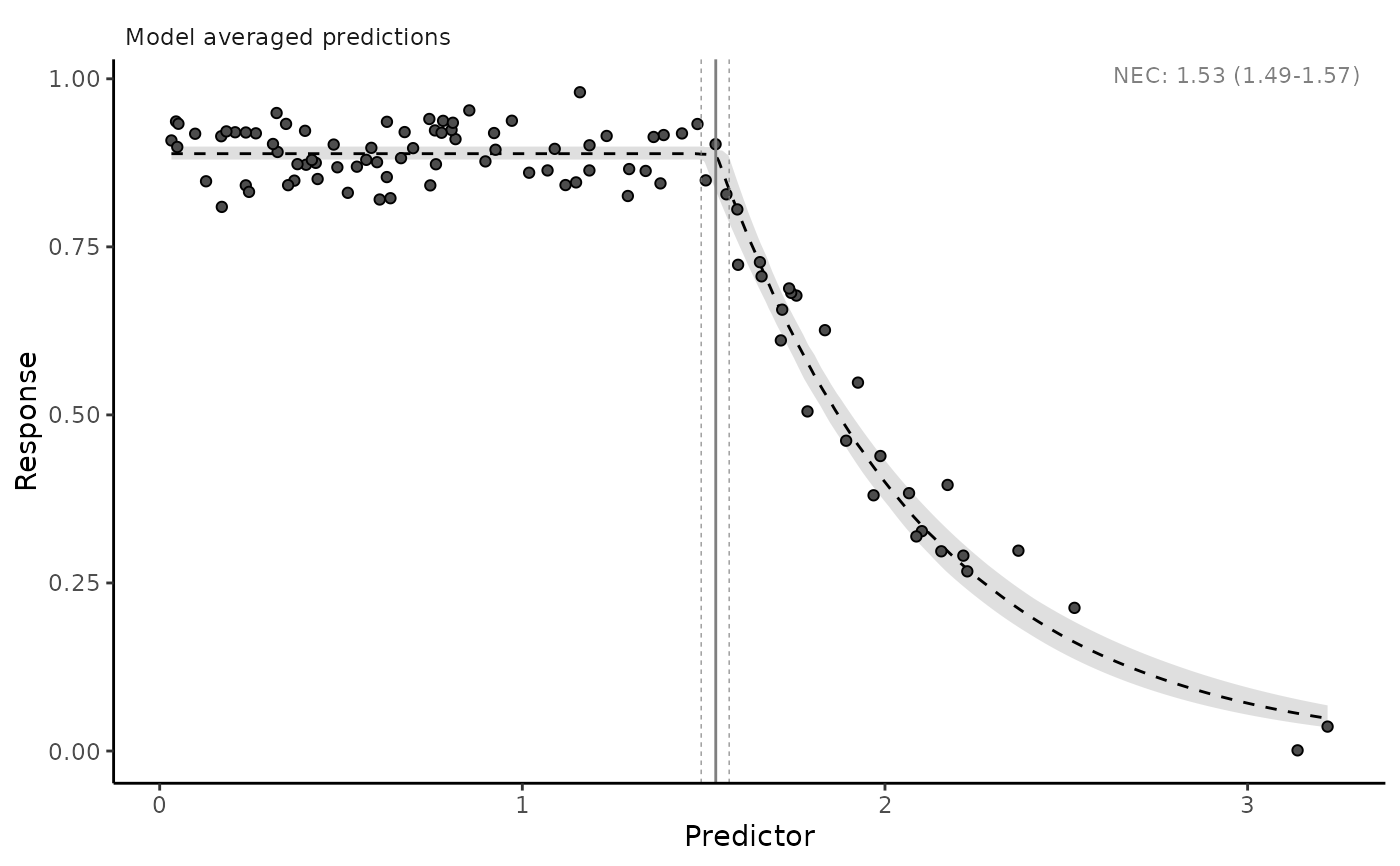
 # plot model averaged predictions
autoplot(necs)
# plot model averaged predictions
autoplot(necs)
 # plot all panels together
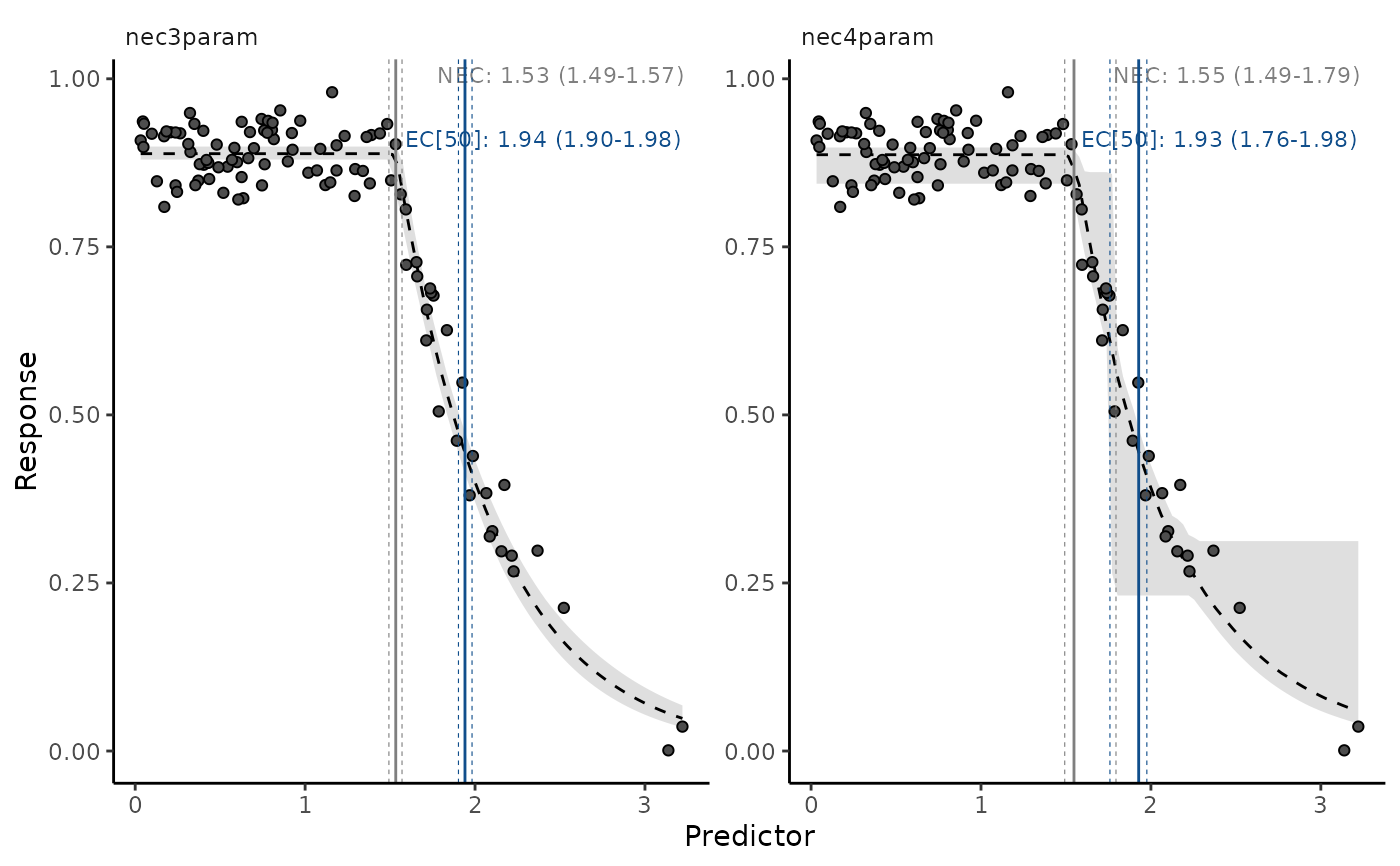
autoplot(necs, ecx = TRUE, ecx_val = 50, all_models = TRUE)
# plot all panels together
autoplot(necs, ecx = TRUE, ecx_val = 50, all_models = TRUE)
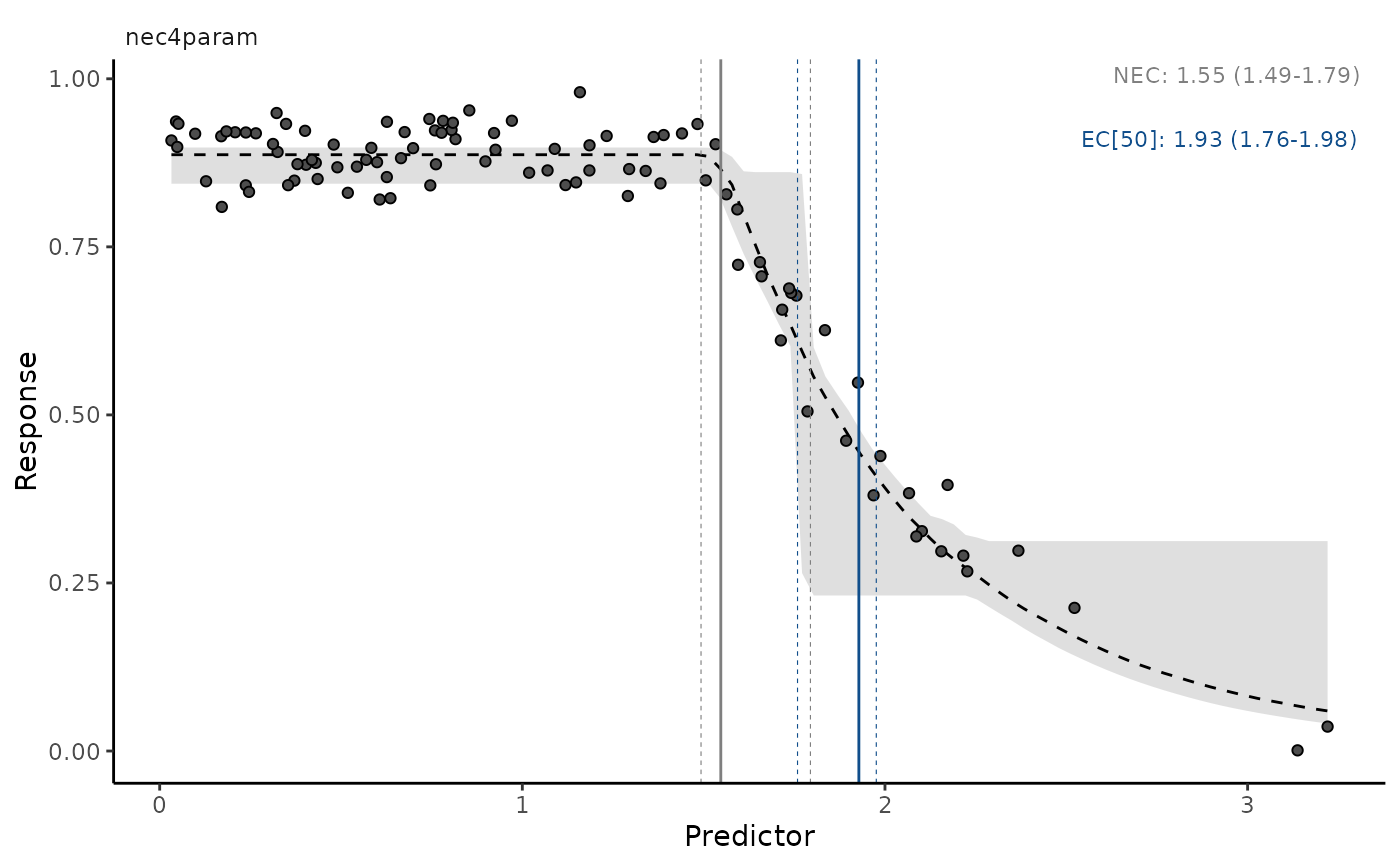
 # plots multiple models, one at a time, with interactive prompt
autoplot(necs, ecx = TRUE, ecx_val = 50, all_models = TRUE,
multi_facet = FALSE)
# plots multiple models, one at a time, with interactive prompt
autoplot(necs, ecx = TRUE, ecx_val = 50, all_models = TRUE,
multi_facet = FALSE)

 # }
# }