Generates a plot for objects fitted by bnec.
x should be of class bayesnecfit or
bayesmanecfit.
# S3 method for class 'bayesnecfit'
plot(
  x,
  ...,
  CI = TRUE,
  add_nec = TRUE,
  position_legend = "topright",
  add_ec10 = FALSE,
  xform = identity,
  lxform = identity,
  jitter_x = FALSE,
  jitter_y = FALSE,
  ylab = "Response",
  xlab = "Predictor",
  xticks = NA
)

# S3 method for class 'bayesmanecfit'
plot(
  x,
  ...,
  CI = TRUE,
  add_nec = TRUE,
  position_legend = "topright",
  add_ec10 = FALSE,
  xform = identity,
  lxform = identity,
  jitter_x = FALSE,
  jitter_y = FALSE,
  ylab = "Response",
  xlab = "Predictor",
  xticks = NA,
  all_models = FALSE
)
Arguments
- x
An object of class
bayesnecfitorbayesmanecfit.- ...
Additional arguments to
plot.- CI
A
logicalvalue indicating if credibility intervals on the model fit should be plotted, calculated as the upper and lower bounds of the individual predicted values from all posterior samples.- add_nec
A
logicalvalue indicating if the estimated NEC value and 95% credible intervals should be added to the plot.- position_legend
A
numericvector indicating the location of the NEC or EC10 legend, as per a call to legend.- add_ec10
A
logicalvalue indicating if an estimated EC10 value and 95% credible intervals should be added to the plot.- xform
A function to be applied as a transformation of the x data.
- lxform
A function to be applied as a transformation only to axis labels and the annotated NEC / EC10 values.
- jitter_x
A
logicalvalue indicating if the x data points on the plot should be jittered.- jitter_y
A
logicalvalue indicating if the y data points on the plot should be jittered.- ylab
A
charactervector to use for the y-axis label.- xlab
A
charactervector to use for the x-axis label.- xticks
A numeric vector indicate where to place the tick marks of the x-axis.
- all_models
A
logicalvalue indicating if all models in the model set should be plotted simultaneously, or if a model average plot should be returned.
Value
A plot of the fitted model.
Examples
# \donttest{
library(bayesnec)
nec4param <- pull_out(manec_example, "nec4param")
#> Pulling out model(s): nec4param
# plot single models (bayesnecfit)
plot(nec4param)
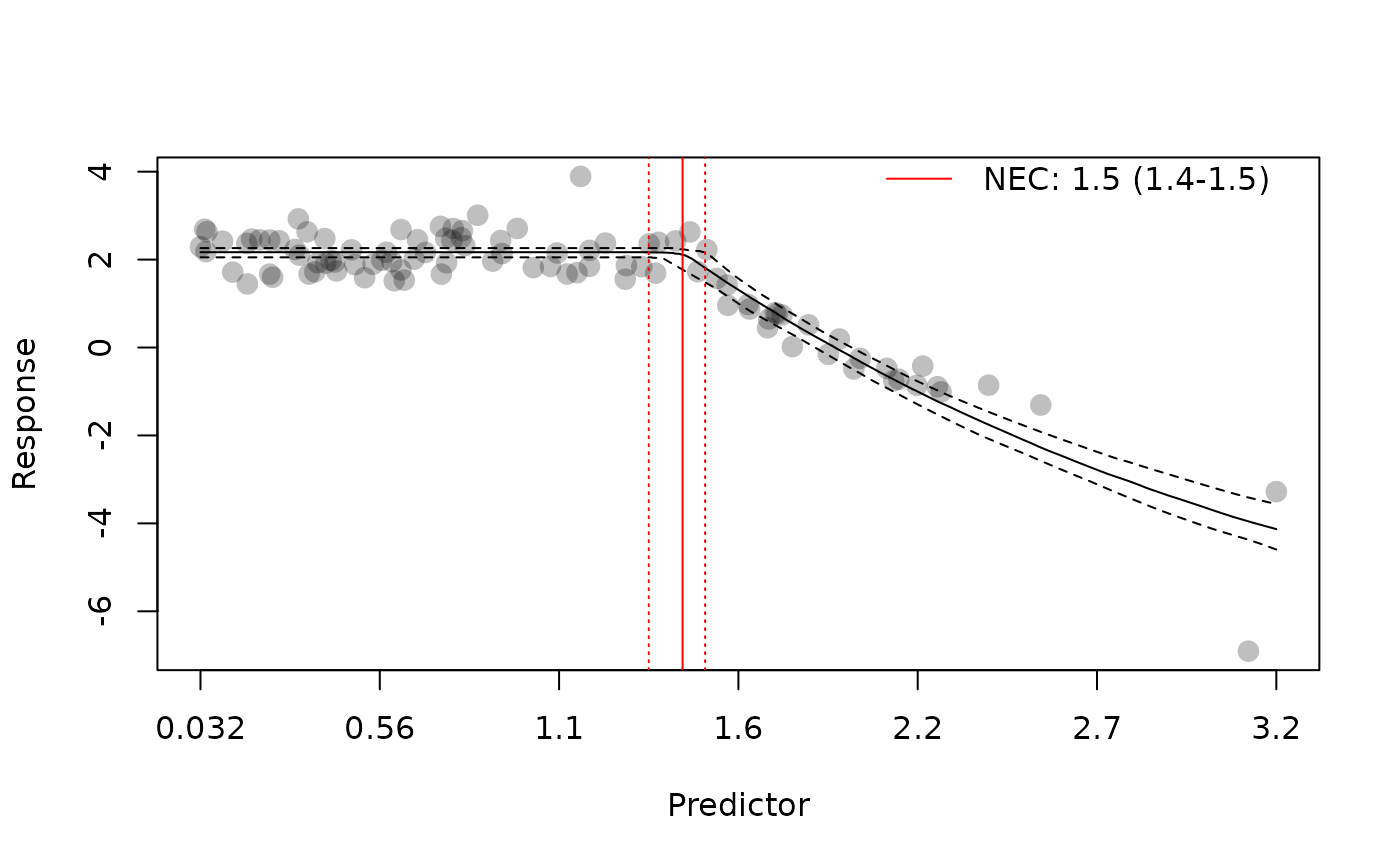 plot(nec4param, add_nec = FALSE)
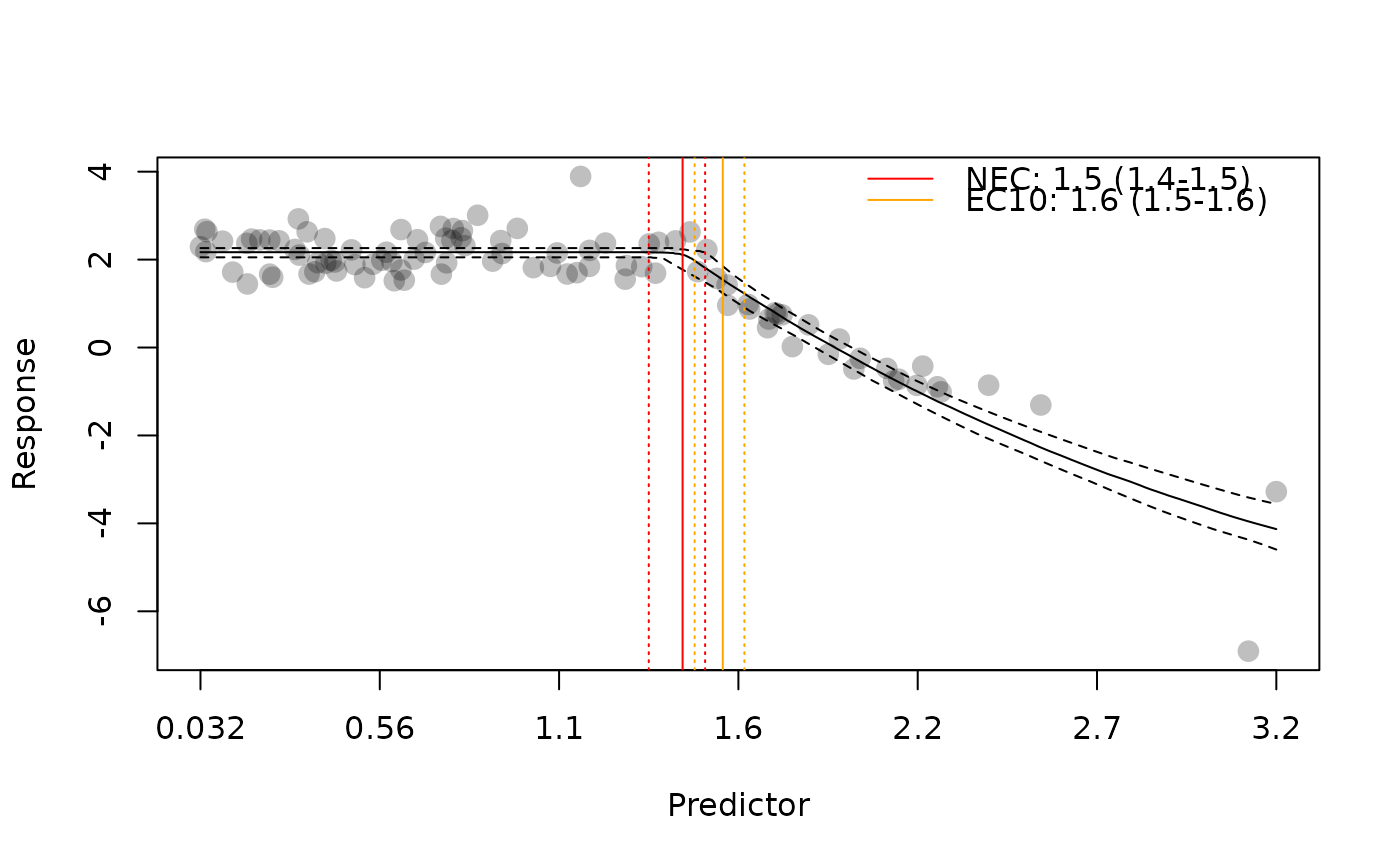
plot(nec4param, add_ec10 = TRUE)
plot(nec4param, add_nec = FALSE)
plot(nec4param, add_ec10 = TRUE)
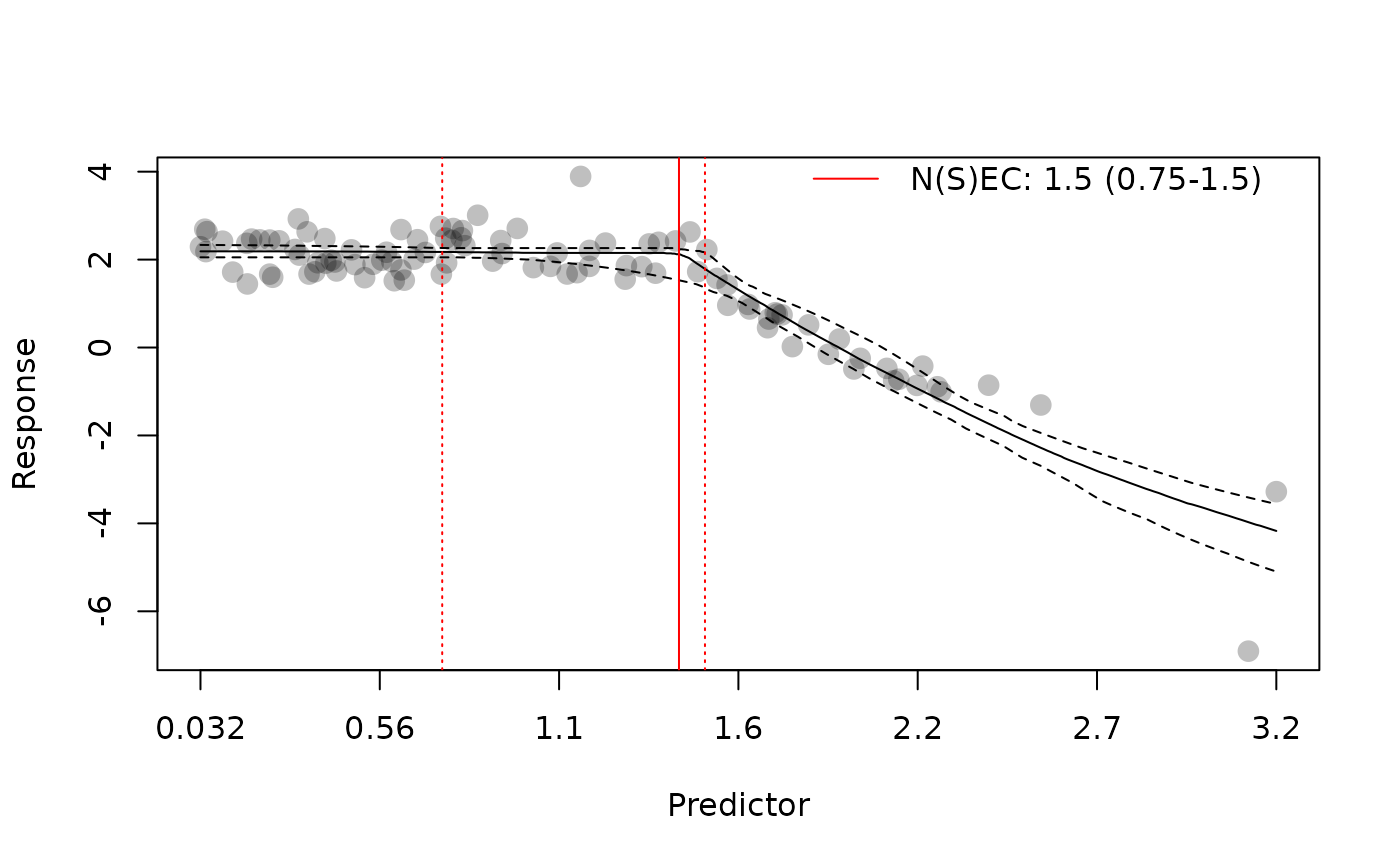
 # plot model averaged predictions (bayesmanecfit)
plot(manec_example)
# plot model averaged predictions (bayesmanecfit)
plot(manec_example)
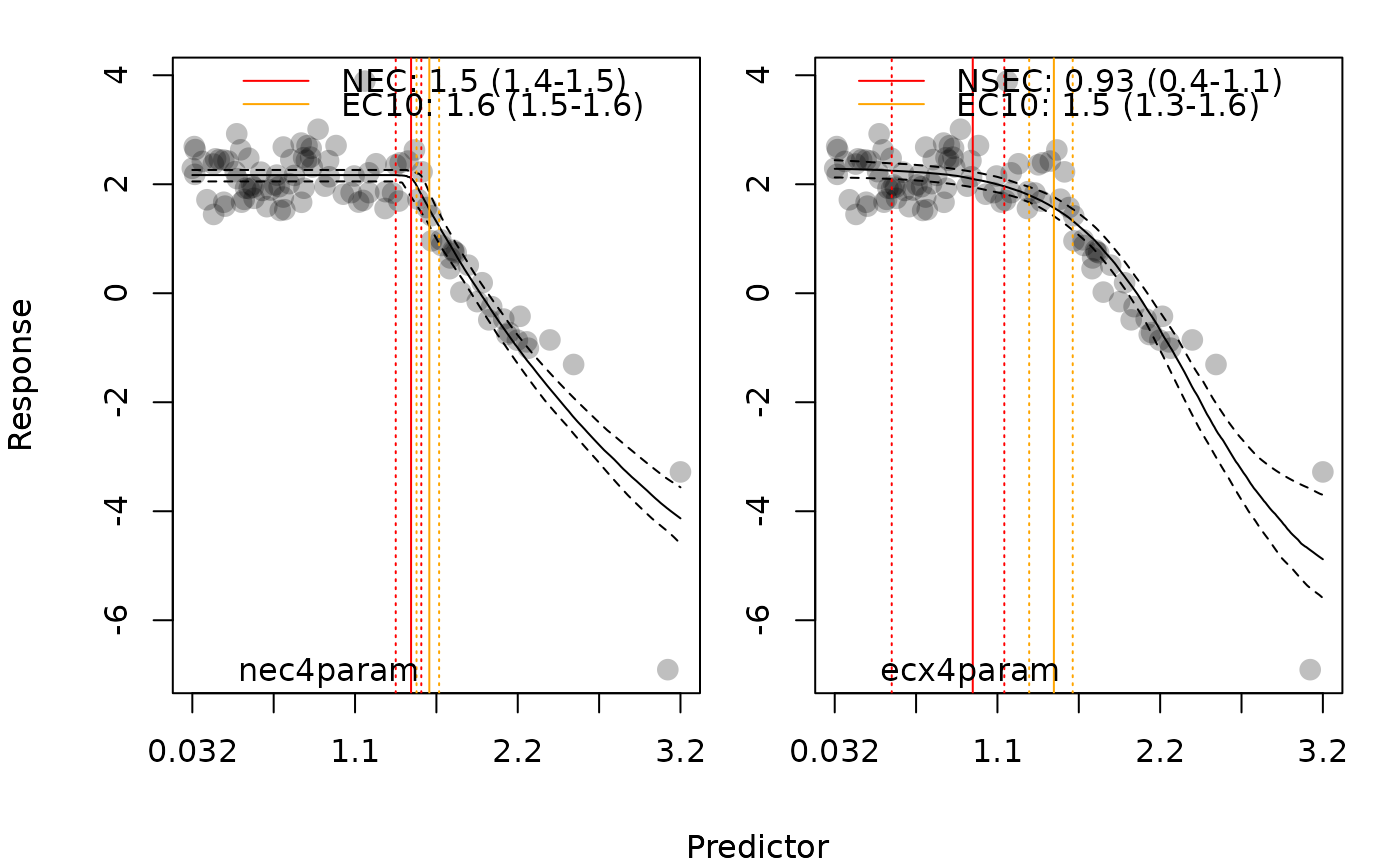
 # plot all panels together
plot(manec_example, add_ec10 = TRUE, all_models = TRUE)
# plot all panels together
plot(manec_example, add_ec10 = TRUE, all_models = TRUE)
 # }
# }