eReefs overview
Introduction to eReefs
A gentle introduction to eReefs — what it is and how to use it.
What is eReefs?
The Great Barrier Reef (the Reef) is the largest coral reef system on earth, covering an area of about 350,000 km\(^2\) off the coast of Queensland, Australia. It is an ecosystem of immense complexity, with a myriad of physical, chemical and biological processes interacting through time to shape the reef which we see today and into the future.
Tracking the health of the Reef has become increasingly important as the cumulative impacts of a range of stressors intensify under a changing climate and jeopardise the future of the Reef as we know it. While the Reef’s great economic, cultural and social value does fuel a considerable amount of research and investment, its shear size means that observations of its condition are relatively few and far between. eReefs aims to solve this problem by using computer modelling to simulate some of the key processes shaping the Reef — from the catchments, to the rivers and estuaries, to the reef lagoon, reef matrix and open ocean — to better understand the ecosystem as a whole and monitor its health in (near) real-time.
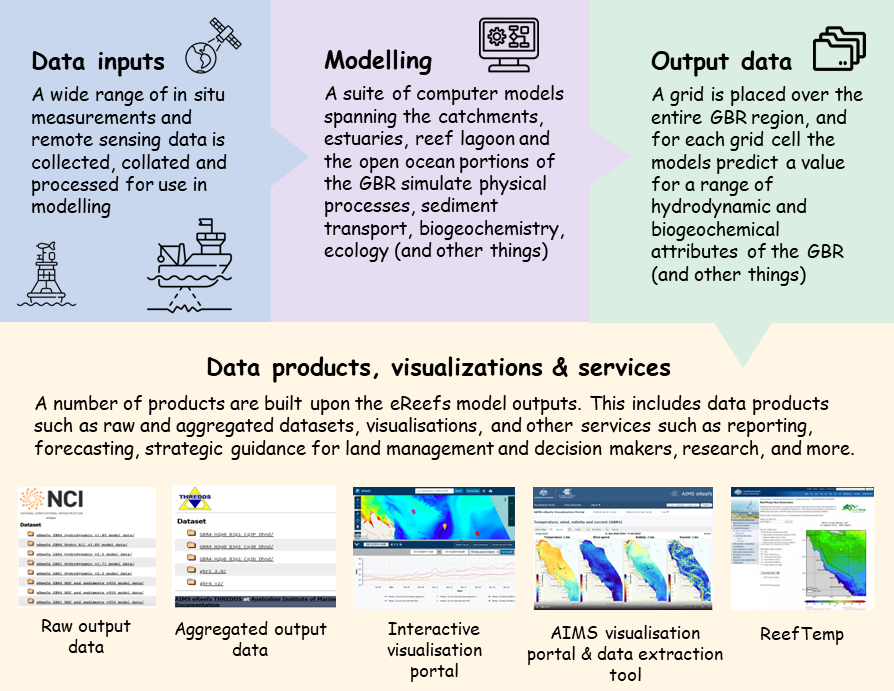
Put simply, eReefs is an information platform which takes data from a wide range of sources and passes it through a series of computer models to get predictions across a number of key attributes of the Great Barrier Reef, such as water temperature, water chemistry, and nutrient and sediment loads. These predictions are routinely generated across the entire extent of the Great Barrier Reef, in near-real-time. The end result is a collection of datasets which are, essentially, snapshots of the Reef’s condition through time. These datasets are the core output of eReefs, with a number of other data products, visualisations, and services built upon them.
A simplified overview of the eReefs information platform is shown in Figure 1.
The eReefs Platform
eReefs is often described as an ‘information platform’ to capture the wide range of information services which can be built upon it. Some examples of these services, along with the different elements which make up the eReefs platform, are shown in Figure 2.
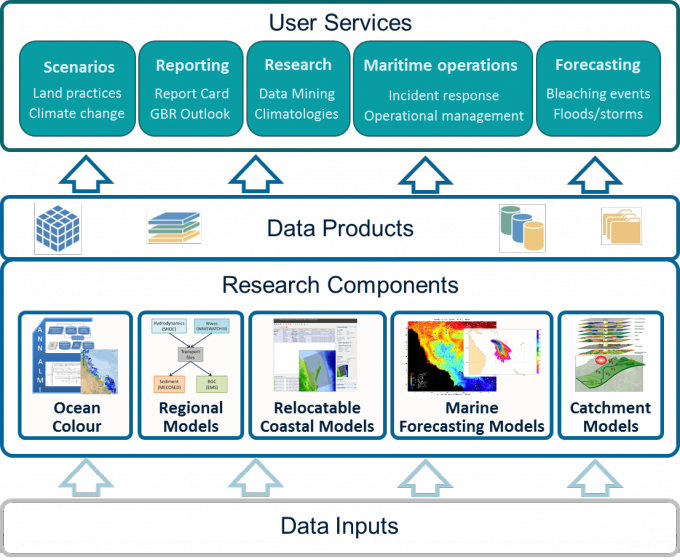
Many different Research Components are used to transform input data into a range of data products. These are mostly computer models (more specifically, numerical models), and include:
Ocean Colour - An optical model which uses satellite imagery to infer the optical properties, i.e. colour, of the waters in the Great Barrier Reef lagoon. The colour of the water actually contains a lot of information on water quality, including things like sediment loads and types, the location of river plumes and phytoplankton blooms, and water circulation structures.
Regional Models - These are the core of the eReefs platform. They include a hydrodynamic model to predict the physical state of the system, a sediment transport model predicting the fate of suspended fine sediments, and a biogeochemical model for water column and benthic production, water quality and nutrient cycling. These models are run across the entire extent of the Great Barrier Reef, from the coastline to the open ocean, at either 4 km or 1 km resolution.
Relocatable Coastal Models (RECOM) - An automated re-locatable modelling system capable of generating high resolution models of hydrodynamics, waves, sediment transport and biogeochemistry, nested within the 4 km or 1 km regional models. Essentially, RECOM implements the regional models over a smaller, user-defined area with much higher resolution.
Marine Forecasting Models - Provide what is essentially a marine weather forecast, capable of providing short-term predictions of water temperature, flow, mixing and quality, among other things.
Catchment Models - Predict the flow of water entering the catchments via rainfall and exiting into the ocean via rivers, as well as the introduction of sediments and pollutants via run-off.
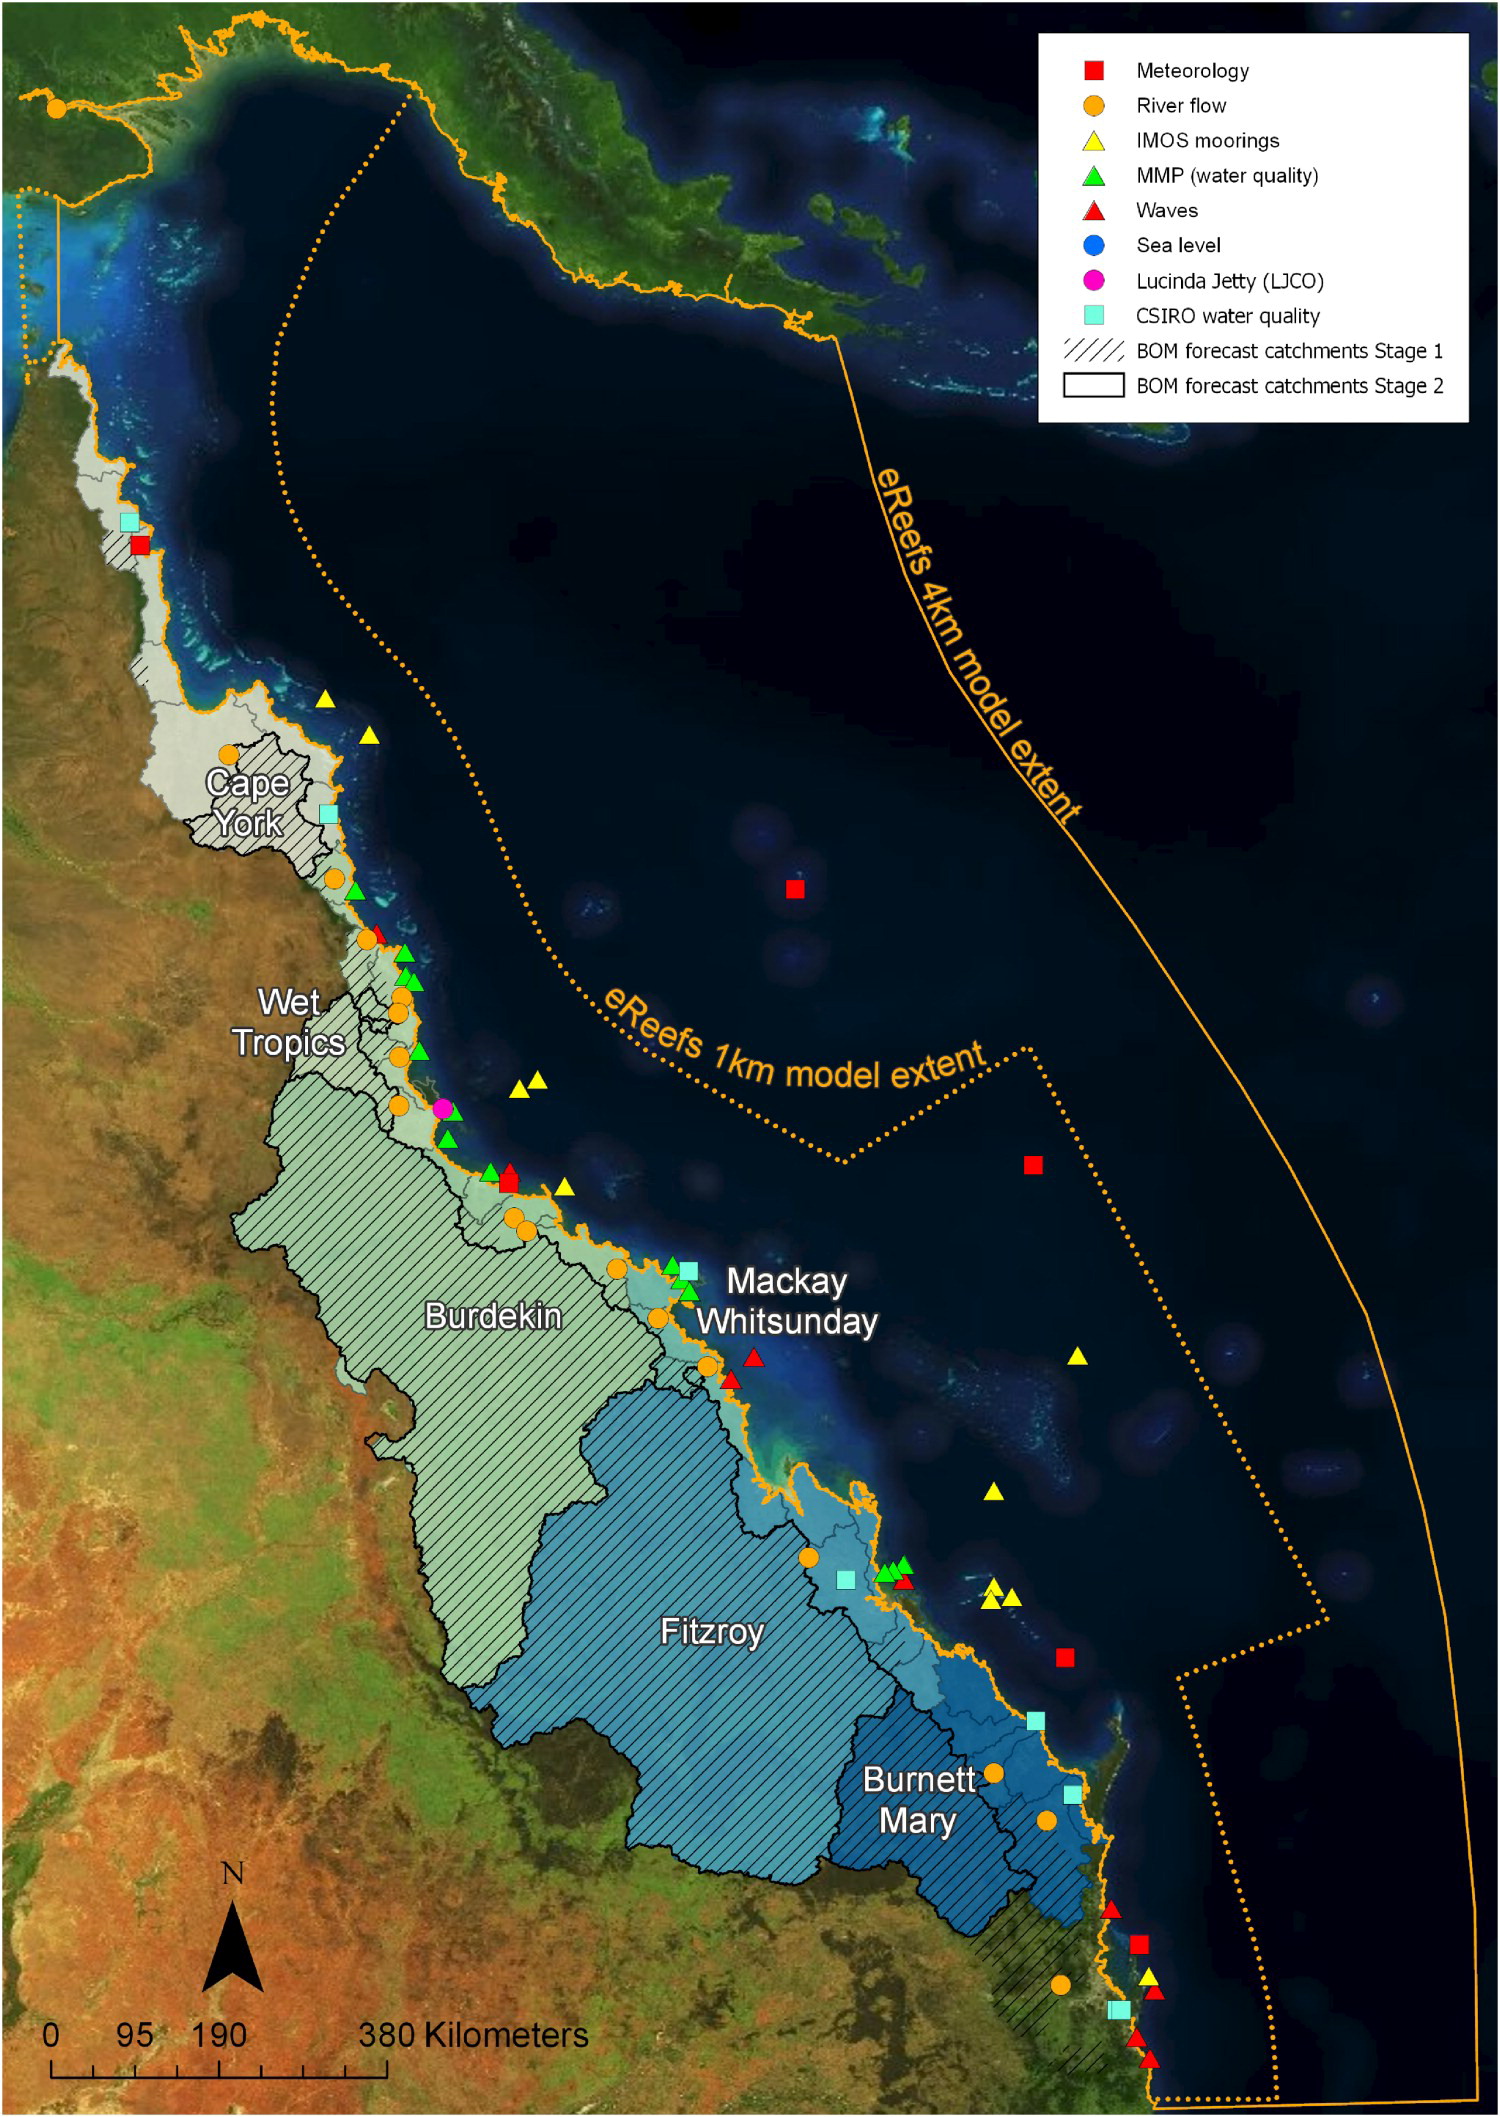
In Figure 3 we can see the extents of the 4 km and 1 km regional models and the catchment models, along with the locations of the in-field input data streams.
The eReefs Regional Models
The Regional Models are the core of the eReefs platform and include three main models, the:
Hydrodynamic model - predicts the physical state of the system
Sediment transport model - predicts the fate of suspended fine sediments
Biogeochemical model - predicts many attributes of water column and benthic production, water quality and nutrient cycling
These models are supported by a wave model, an optical model, a carbon chemistry and reef processes model, catchment models and data assimilation systems.
Model grids and extents
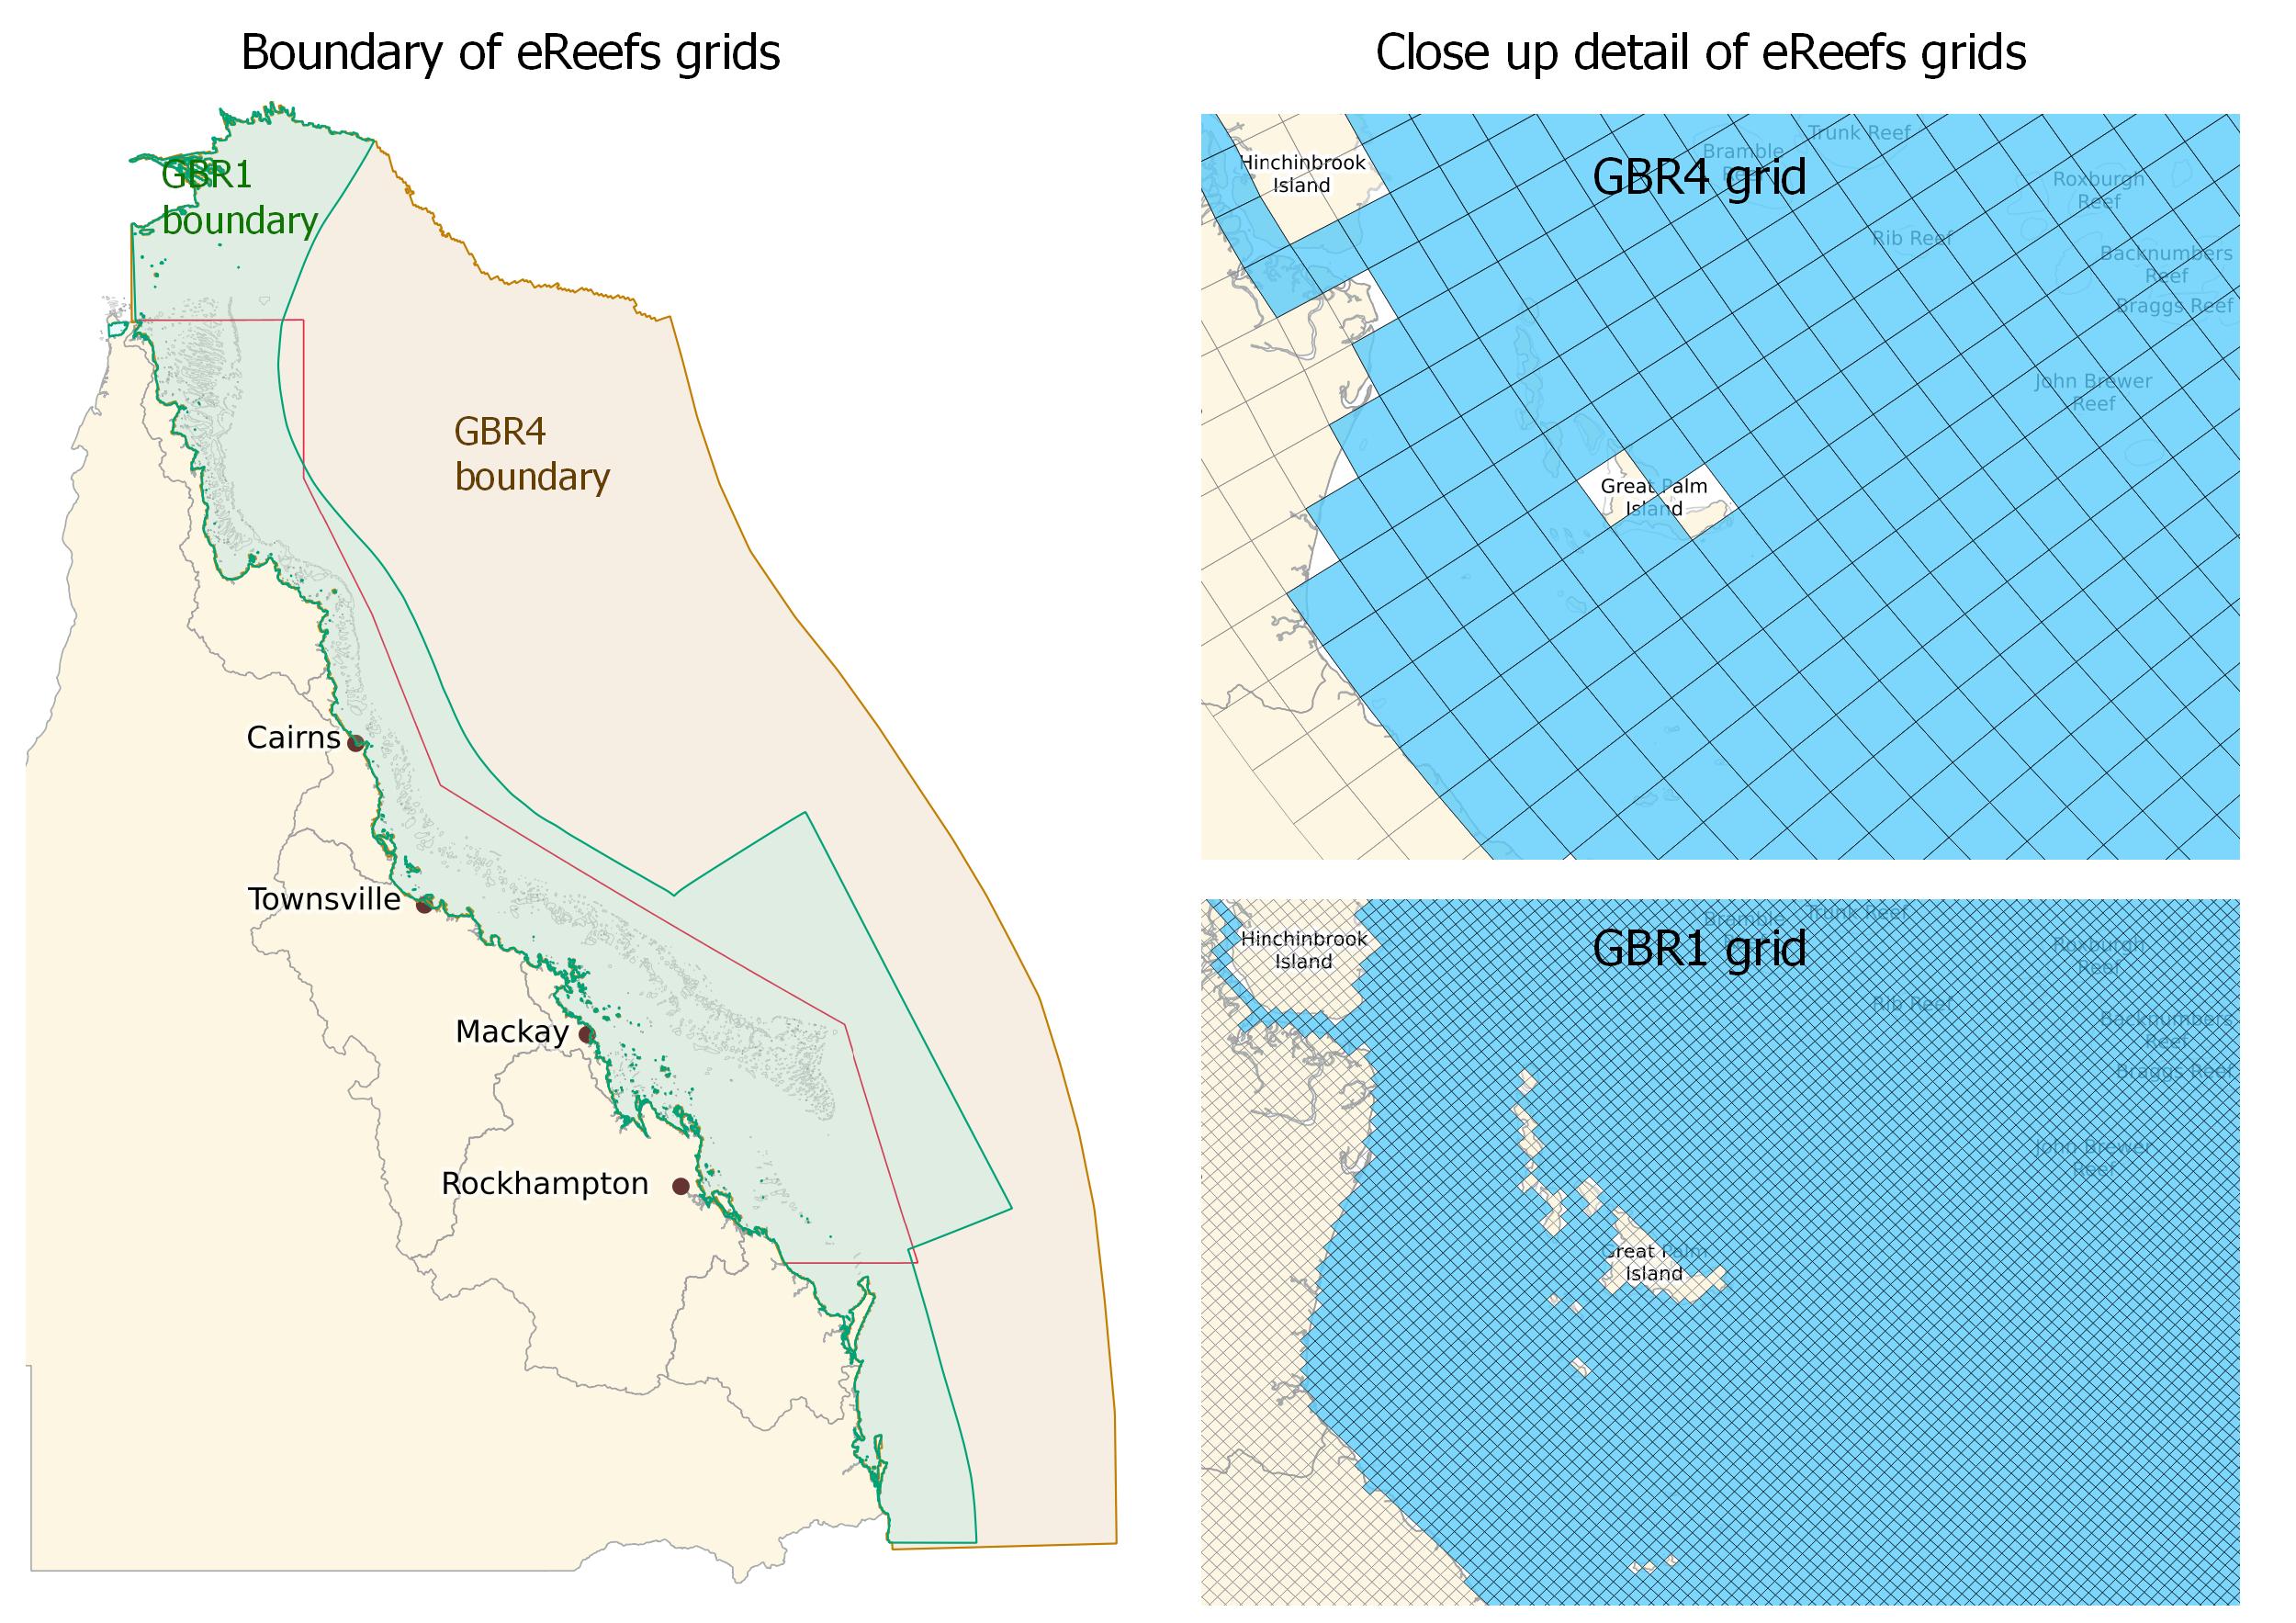
The models are run using a curvilinear orthogonal grid, where their total spatial extent is divided into many grid cells (a.k.a. pixels) of approximately 4 km and 1 km resolution; dubbed the GBR4 and GBR1 models, respectively. For each grid cell, the models predict values across a consistent set of reef attributes at a range of depths in the water column.
Both the GBR1 and GBR4 models extend along the Queensland coast from Papua New Guinea to the New South Wales border, and offshore to beyond the continental slope. The 4 km model encompasses some of the Western Coral Sea and the Queensland Plateau, whereas the 1 km model is limited to the shelf regions. The boundaries of both models are shown in Figure 4 along with the grid sizes.
The eReefs model grid uses a curvilinear grid that is curved to follow the general shape of the Queensland coastline. This grid type differs in structure from regular rectangular grids used in most GIS raster data files. The use of curvilinear grids helps improve the model efficiency by reducing the number of simulation grid cells. The downside is there are limited tools that know how to correctly handle these curvilinear grids. The curvilinear data are stored in the NetCDF data files as normal tables of numbers (typically four dimensional, vertical, horizontal, depth and time). Instead of the vertical and horizontal dimensions corresponding to an equally spaced grid of latitudes and longitudes, the actual position of the each vertical and horizontal index needs to be looked up in the ‘longitude’ and ‘latitude’ tables in the data to determine their action locations. If you plot the data without considering the curvilinear nature of the data then you will see a distorted Queensland coastline.
To make eReefs easier to work with, in many situations, we provide a regridded version of most of the eReefs data. These are provided from the AIMS eReefs THREDDS catalogue. This regridded derivative converts the curvilinear model data to a regular grid using Inverse Distance Weighted interpolation. Full details of this regridding are provided in the Technical Guide to Derived Products from CSIRO eReefs Models. The regridding allows these data files to be processed and visualised directly in desktop GIS applications such as QGIS and ArcGIS Pro. These regridded products are also typically a temporal aggregation of the raw model data, reducing the original hourly data to a daily, monthly or annual average. This makes the data files significantly smaller and manageable. There is no regridded version of the hourly hydrodynamic model, because this would have required too much additional storage. If you need to work with the hourly scale gridded data, then you need to work with the raw curvilinear model data provided on the NCI THREDDS data service. To help work programmatically with the curvilinear data CSIRO developed an extension to the xarray Python library called emsarray. This natively understands how to handle the eReefs curvilinear grids.
Relocatable Coastal Model (RECOM)
In addition to the 4 km and 1 km resolution models, the eReefs platform also contains a Relocatable Coastal Model (RECOM) which offers higher resolution over smaller, user-defined areas. We do not yet cover the use of RECOM in these tutorials. Learn more about RECOM.
The eReefs Outputs
The core outputs from the eReefs platform are the datasets produced by the Hydrodynamic and Biogeochemical Regional Models. These datasets contain the predicted values across a range of variables for different points in time and three-dimensional space (latitude, longitude and depth in the water column and benthic layers).
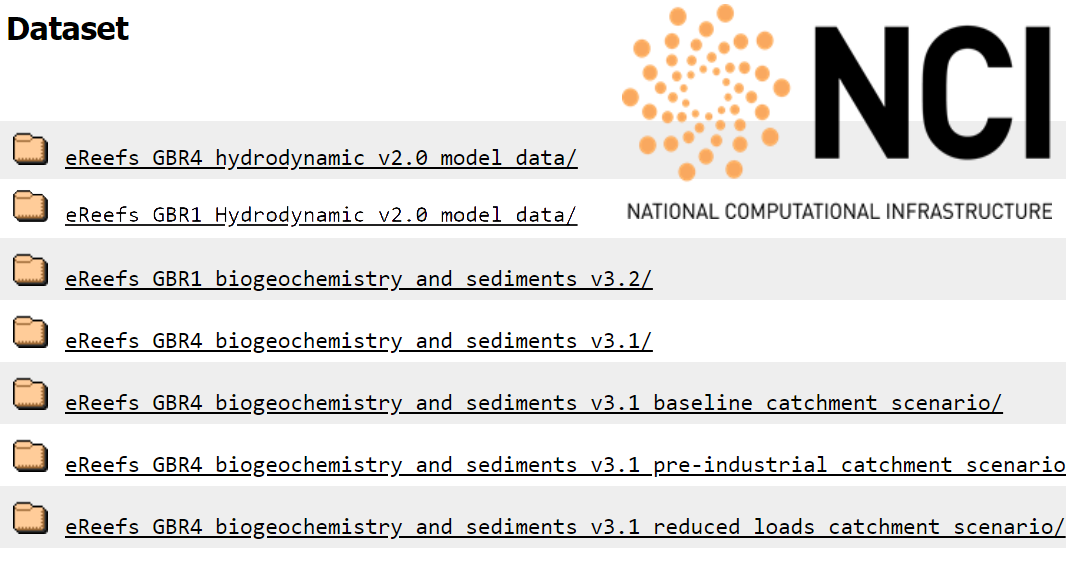
The outputs are available in both 4 km and 1 km resolution. An overview of the different raw model outputs available on the National Computer Infrastructure (NCI) eReefs server is shown in Table 1, the different variables contained in each model is presented in Model output variables.
Near-real-time modelling
A near-real-time and hindcast version of the models were produced in version 2.0 of the hydrodynamic model. This operated up until Jan 2024 when the near-real-time model was stopped. A set of river gauge stations that provided river flow data to the near-real-time model were destroyed by Cyclone Jasper.
Hindcast modelling
From 2025 the near-real-time model was paused and the focus shifted to releasing progressive extensions to the hindcast models. The hindcast models are delayed from near real time and can be up to several years behind. While this can limit their application they do have the advantage of an improved model accuracy. As they are processed in batches the input data driving the model can come from data sources that include more quality control processes. This additional time also allows the model researchers to review the model outputs prior to their publication, allowing data issues to be resolved prior to their input into the model.
Available outputs
| Model | Version | Resolution | Type | Date from | Date to | Time interval |
|---|---|---|---|---|---|---|
| Hydrodynamic GBR1 | 2.0 | 1 km | Near-real-time & hindcast | December 2014 | Present | Hourly |
| Hydrodynamic GBR4 | 2.0 | 4 km | Near-real-time & hindcast | September 2010 | Present | Hourly |
| Biogeochemical GBR1 | 3.2 | 1 km | Near-real-time | October 2019 | Present | Daily |
| Biogeochemical GBR4 | 3.1 | 4 km | Near-real-time | October 2019 | Present | Daily |
| Biogeochemical GBR4 Baseline | 3.1 | 4 km | Hindcast | 2010-12-01 | 2019-04-30 | Daily |
| Biogeochemical GBR4 Pre-industrial | 3.1 | 4 km | Hindcast | 2010-12-01 | 2019-04-30 | Daily |
| Biogeochemical GBR4 Reduced loads | 3.1 | 4 km | Hindcast | 2010-12-01 | 2019-04-30 | Daily |
Output variables
Download the model variables list
You can download the below lists of the model variables in .xlsx format: ereefs_hydro_bgc_model_variables.xlsx.
Lists currently incomplete
The below lists of model variables are not yet complete. While, for the Hydrodynamic model, all the variables are listed, some are missing descriptions. For the Biogeochemical model, which contains over 350 variables, not all model variables are listed. We aim to complete this list in time, as well as specify which variables are included in the AIMS aggregated model outputs (see Accessing model data below).
eReefs model depths
The eReefs models are three dimensional, modelling the water column as a series of depth layers. Each layer represents a segment of the water column between two depths, with the spacing of the layers increasing with depth. With v4.0 of the hydrodynamic model and the matching v3.2 of the BGC model the depths of layers vary between the GBR1 and GBR4 grids.
When working with eReefs you typically need to pick a depth layer to extract. The index (k) of the depth variable (zc) varies between the raw model data, that has the full range of depths, and the regridded data that only has a subset of the depths.
Raw FX3 models (GBR1 v2.0 & GBR4 v4.0)
| k (GBR1 v2.0) | Depth (m) | k (GBR4 v4.0) | Depth (m) |
|---|---|---|---|
| 0 | -3885.0 | 0 | -3890.0 |
| 1 | -3660.0 | 1 | -3680.0 |
| 2 | -3430.0 | 2 | -3480.0 |
| 3 | -3195.0 | 3 | -3280.0 |
| 4 | -2965.0 | 4 | -3080.0 |
| 5 | -2730.0 | 5 | -2880.0 |
| … | … | … | … |
| 38 | -9.0 | 41 | -5.55 |
| 39 | -5.35 | 42 | -3.00 |
| 40 | -2.35 | 43 | -1.50 |
| 41 | -0.50 | 44 | -0.50 |
| 42 | 0.50 | 45 | 0.50 |
| 43 | 1.50 | 46 | 1.50 |
Regridded aggregate models (GBR1 v2.0 & GBR4 v4.0)
| k (GBR1 agg) | Depth (m) | k (GBR4 agg) | Depth (m) |
|---|---|---|---|
| 0 | -140.0 | 0 | -145.0 |
| 1 | -120.0 | 1 | -120.0 |
| 2 | -103.0 | 2 | -103.0 |
| 3 | -88.0 | 3 | -88.0 |
| 4 | -73.0 | 4 | -73.0 |
| 5 | -60.0 | 5 | -60.0 |
| … | … | … | … |
| 10 | -18.0 | 11 | -12.75 |
| 11 | -13.0 | 12 | -8.80 |
| 12 | -9.0 | 13 | -5.55 |
| 13 | -5.35 | 14 | -3.00 |
| 14 | -2.35 | 15 | -1.50 |
| 15 | -0.50 | 16 | -0.50 |
Accessing outputs
The eReefs Hydrodynamic and Biogeochemical model outputs are available in two types:
Raw outputs - Model outputs published by the Commonwealth Scientific and Industrial Research Organisation (CSIRO) on the National Computational Infrastructure (NCI) THREDDS server. They contain the model outputs at hourly (Hydrodynamic) or daily (Biogeochemical) time intervals.
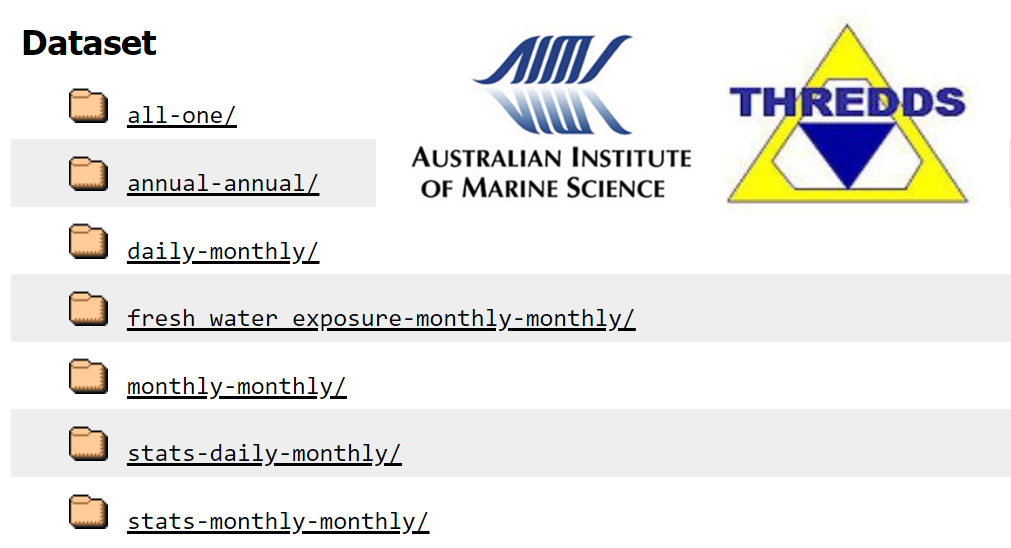
Aggregated outputs - Daily, monthly, and yearly aggregated model outputs processed and published by the Australian Institute of Marine Science (AIMS) on the AIMS eReefs THREDDS catalogue They contain aggregated model outputs. For a given variable and model grid cell, the raw model output values are collected and processed to get the either the daily, monthly or yearly mean value.
The output datasets can be accessed in a range of different ways — these are listed below.
NCI Server
Raw outputs
NetCDF file format
OPeNDAP, HTTPS, WMS
AIMS eReefs THREDDS Server
Aggregated outputs
NetCDF file format
OPeNDAP, HTTPS, WMS
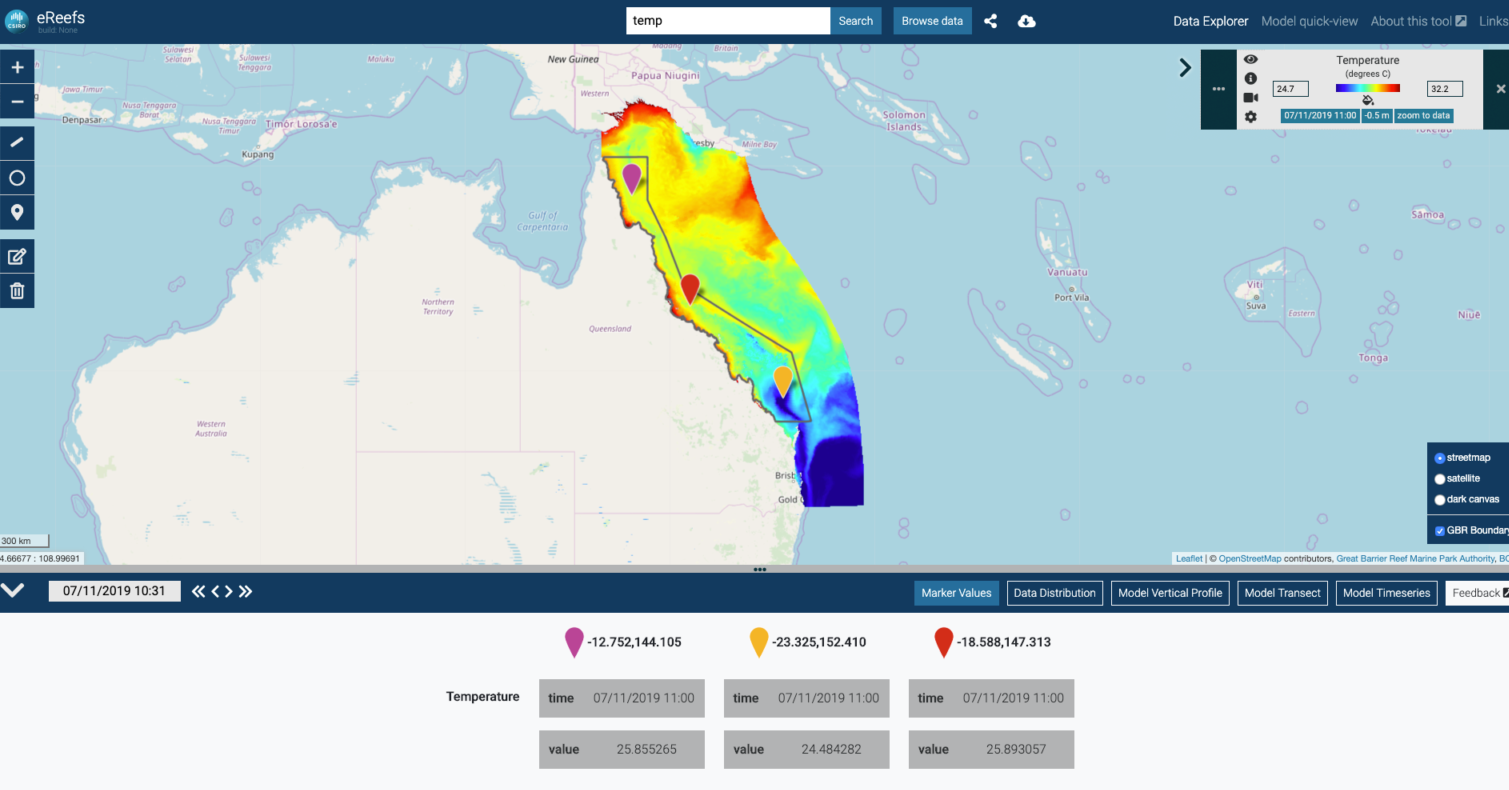
Data Explorer
Raw outputs
Point-and-click user interface
Visualise data as you go
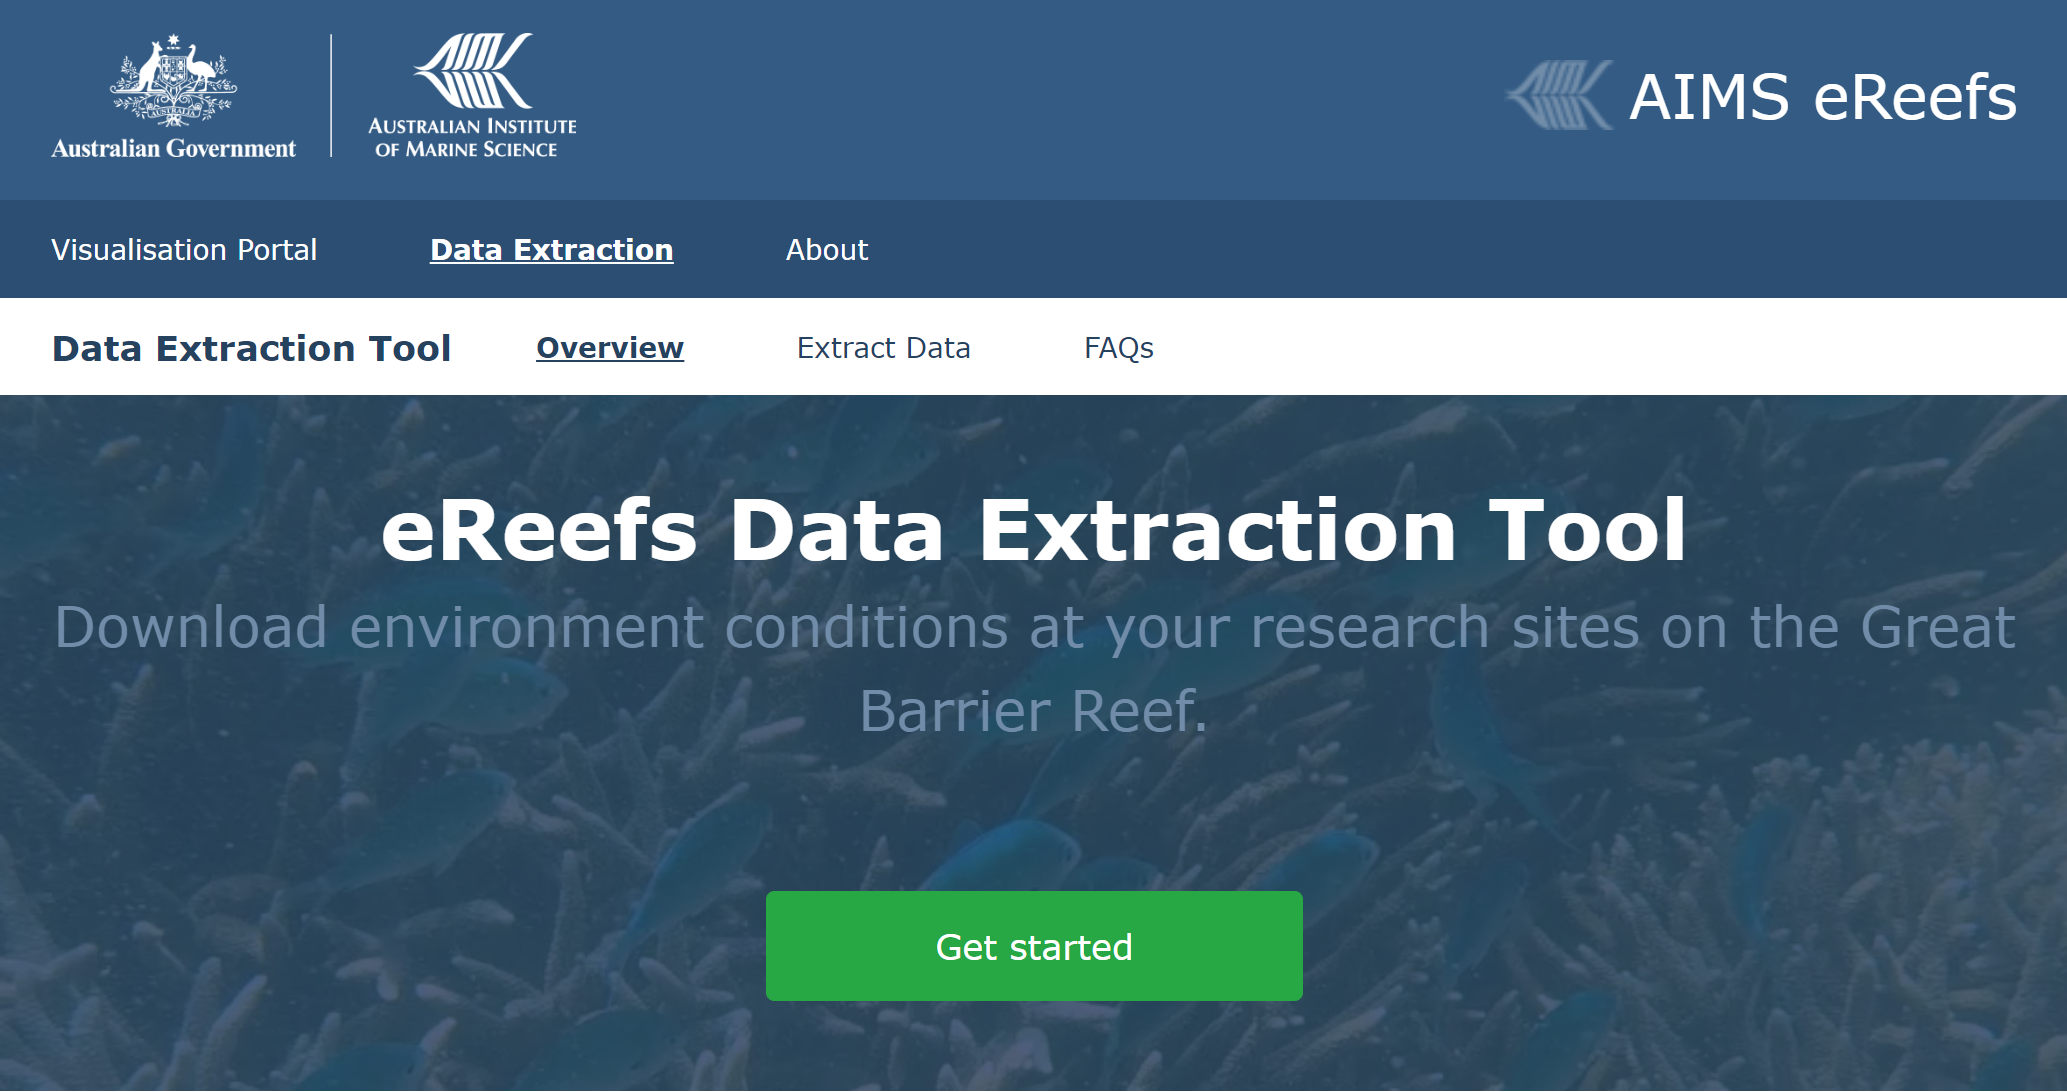
AIMS Data Extraction Tool
Raw and Aggregated outputs
Point-and-click user interface
CSV file format
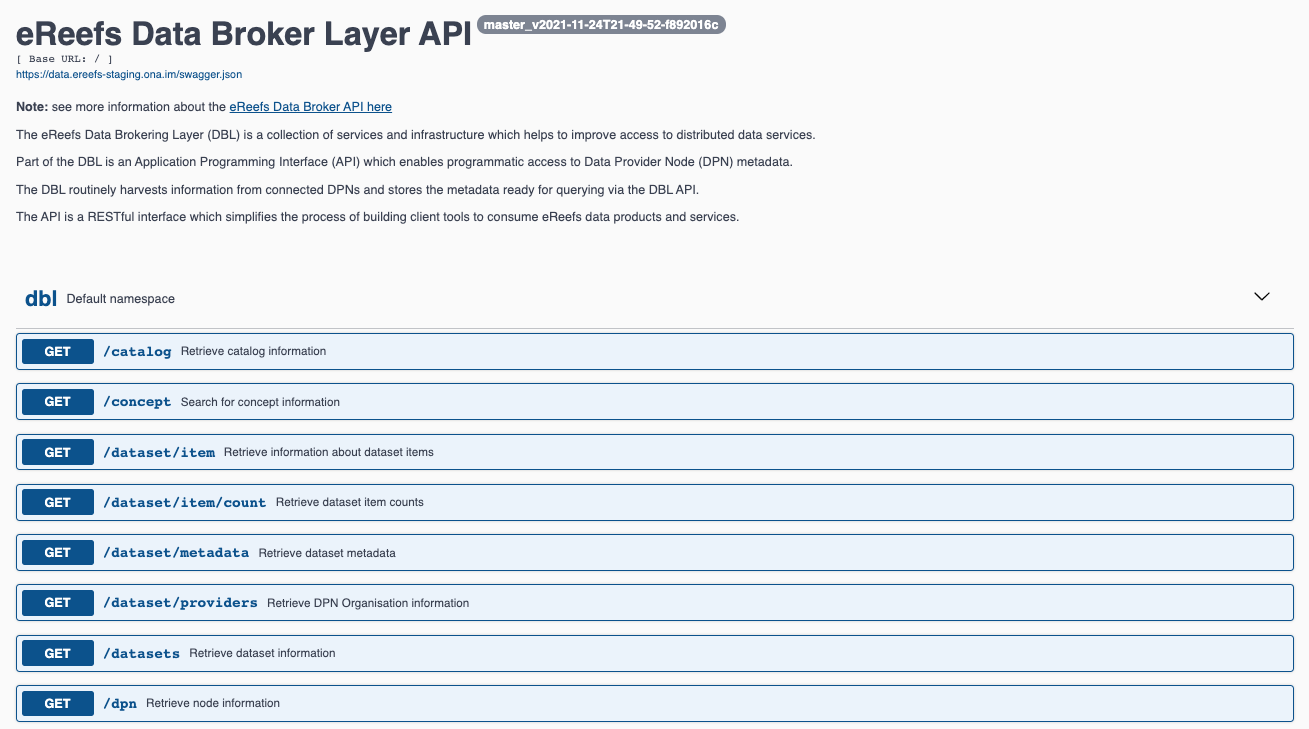
Data Brokering API
Raw outputs
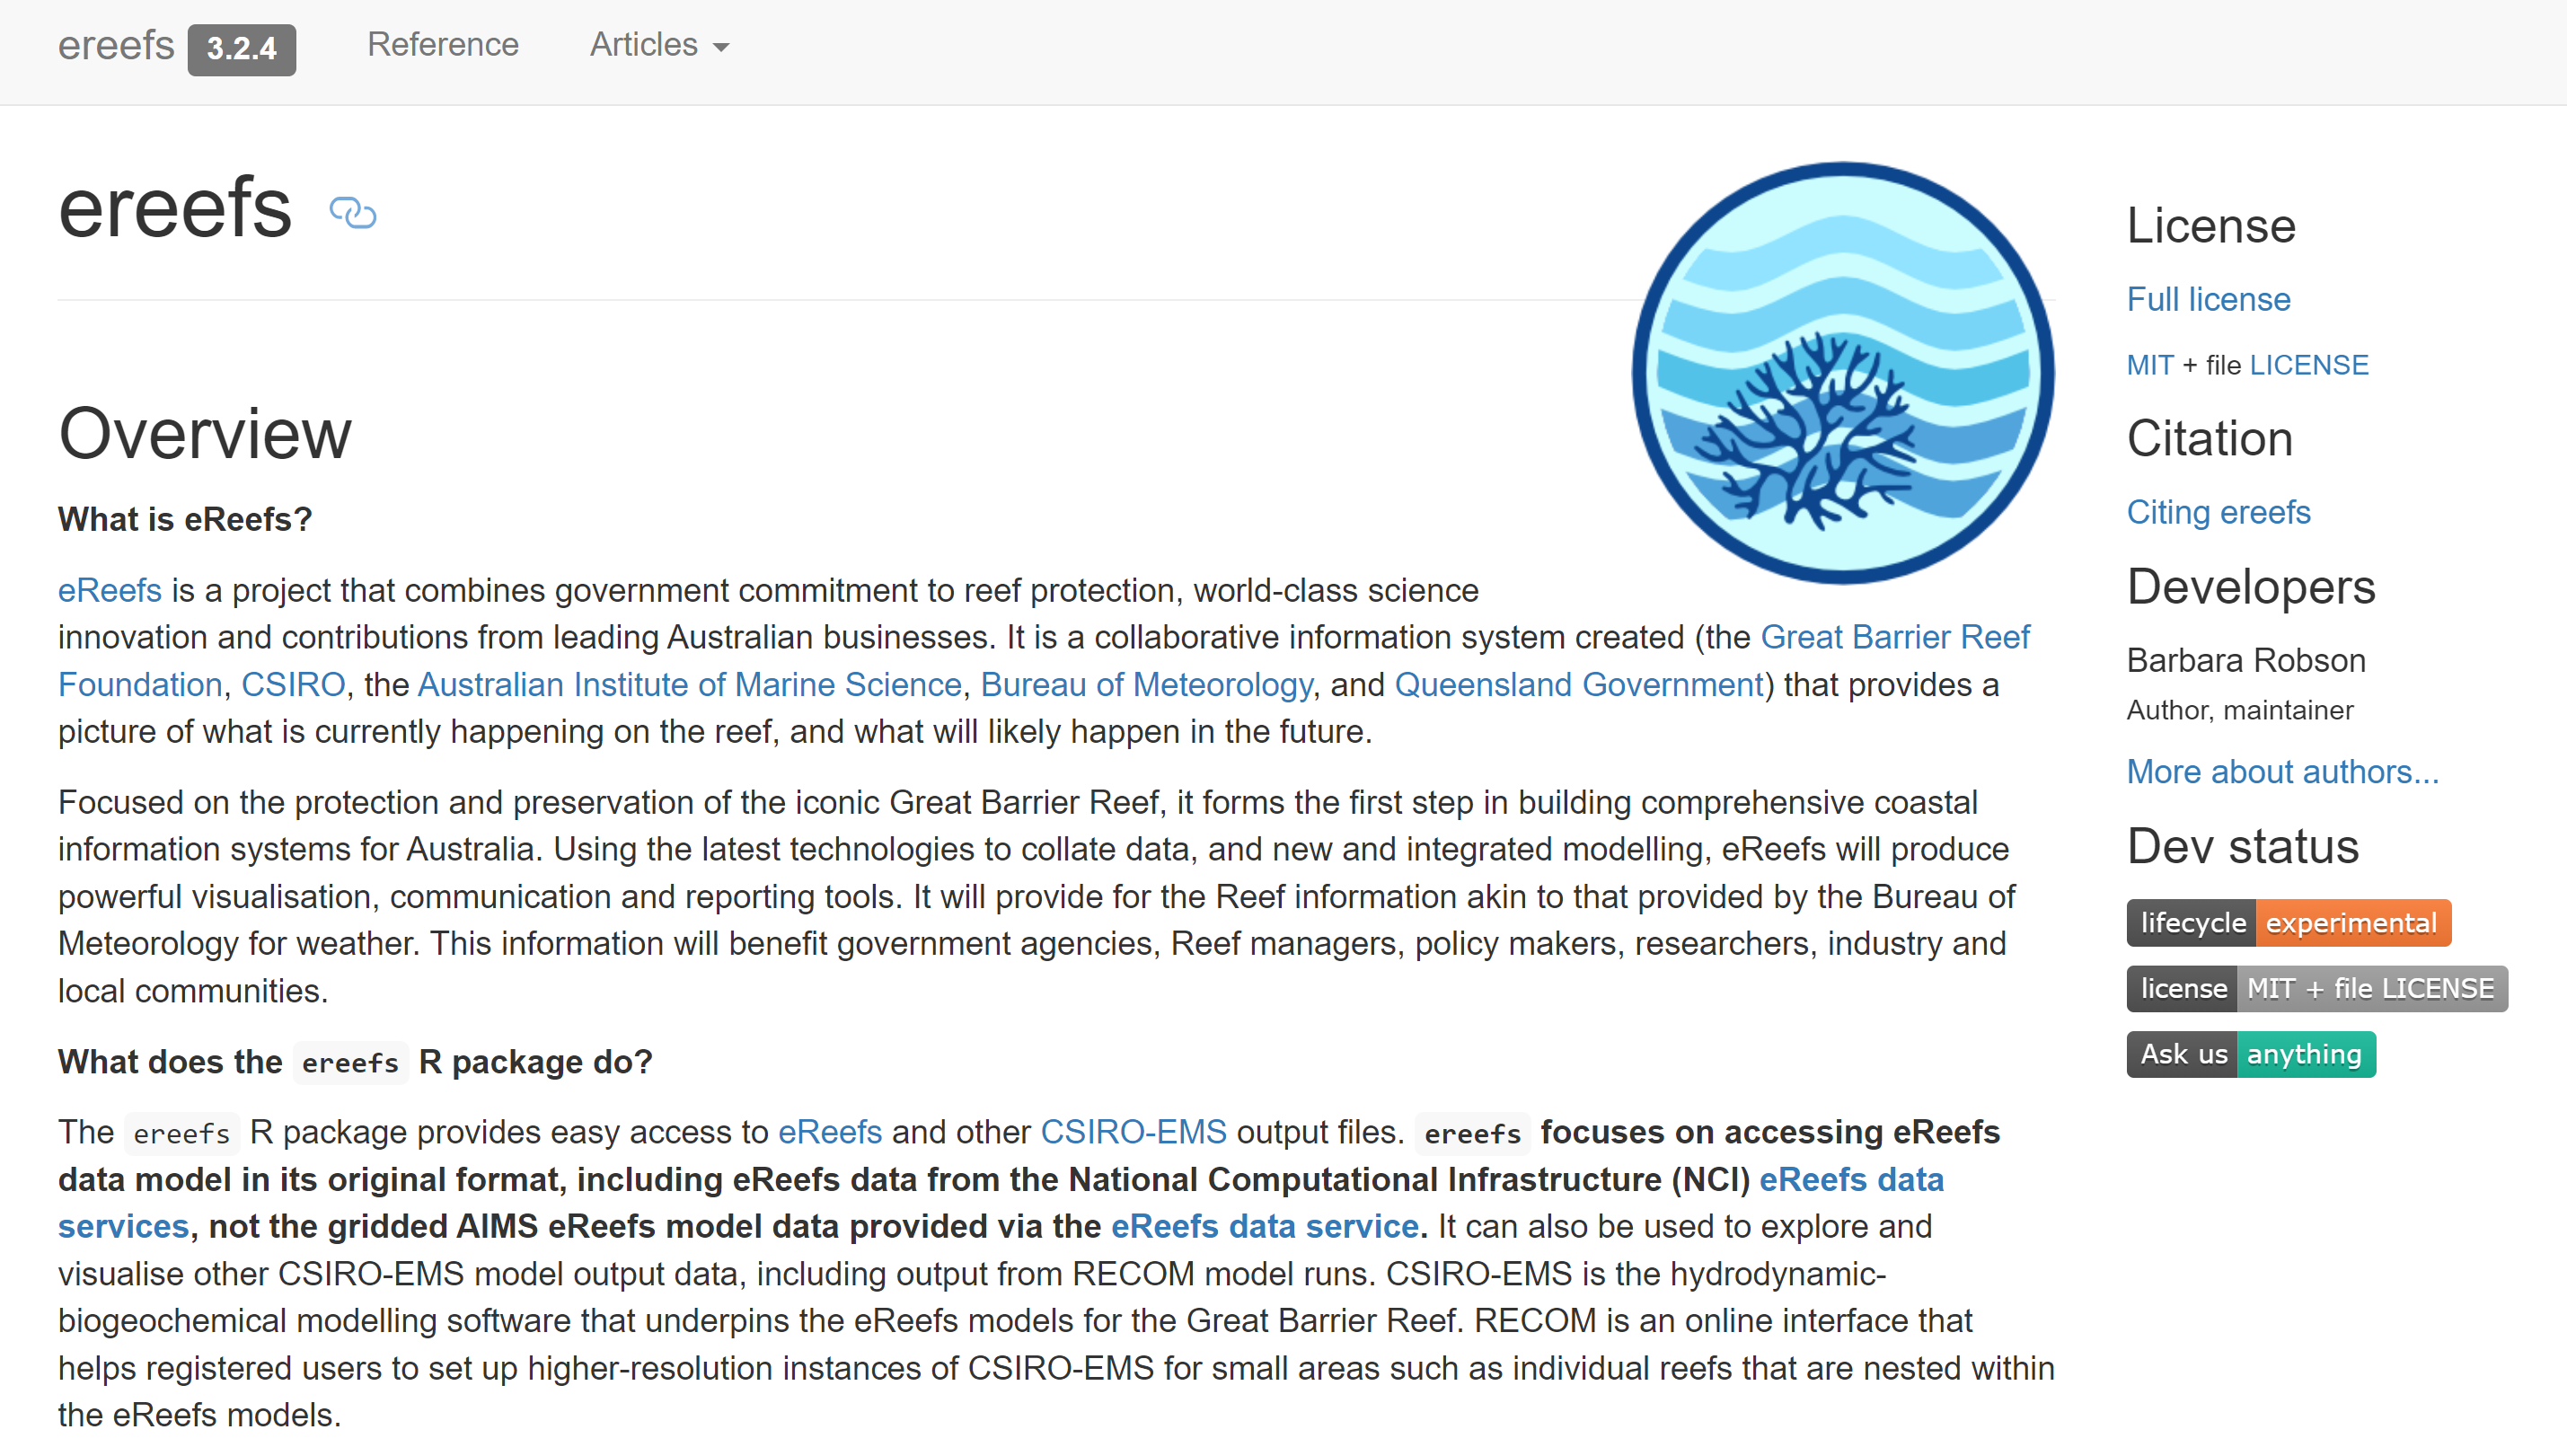
ereefs R package
Raw outputs
R scripting interface
Using eReefs Data
Applications
Reef management challenges for which the eReefs modelling suite has application are numerous and include prediction of coral bleaching hotspots, impacts of ocean acidification on coral calcification, catchment impacts on reef health (sedimentation issues, eutrophication), crown of thorns starfish (COTS) infestations, hypoxia, management of dredging, shipping and port related activities, fisheries management, search and rescue, larval connectivity and prediction of impacts of floods or extreme weather events on marine systems. Since the modelling package operates routinely in near real-time, emergent events such as floods, dredge plumes, phytoplankton blooms, cyclones, vessel groundings, bleaching events etc. may be investigated and responded to in a timely manner.
Limitations
The eReefs Hydrodynamic and Biogeochemical (BGC) datasets are based on spatial and temporal models, and as such only provide estimates of the environmental conditions. The data does not come from in-water measurements and thus will have a spatially varying level of error in the modelled values.
For further information on model accuracy and validation, see the eReefs research paper.
A technical assessment of the skill level of the BGC version 3.1 model shows that the absolute accuracy of the BGC model varies significantly with variable and location. As a result care should be taken to ensure the model is fit-for-purpose and in general BGC results should used in combination with second sources of information when making inferences or management decisions.
The modelled scenarios run for version 3.1 of the BGC model were developed for the purpose of comparing catchment run off effect comparison. As such they were driven with historic weather and river flow boundary conditions, but the sediment and nutrient loads were based on the results of the 2019 Source Catchment modelling. In this catchment modelling the land use is static over the simulation run. This means that for the ‘Baseline’ scenario this uses estimated land use from 2019 applied over all years (2010 - 2019). As a result improvements in land practices are effectively back dated to start of the simulation (2010). This results in early years in the simulation having slightly lower nutrient and sediment loads then actually happened. The BGC modelling team indicated this approach is likely to introduce small additional errors in places where the land practices have improved significantly, but are likely to be smaller than the inherent errors in the model. These errors only apply if the Baseline model data is interpreted as an estimate of historic conditions, rather than the original intended purpose of the scenario comparison.
The wind data used for the Hydrodynamic model is originally from the BOM Access-R weather models. These models capture synoptic winds and some of the features of cyclones, however they do not represent the high speed winds near the eye of cyclones well. For this reason the maximum wind speed aggregations do not capture the peak winds of cyclones.