Visually inspect uncertainty for input mixing proportion
Source:R/plotting.R
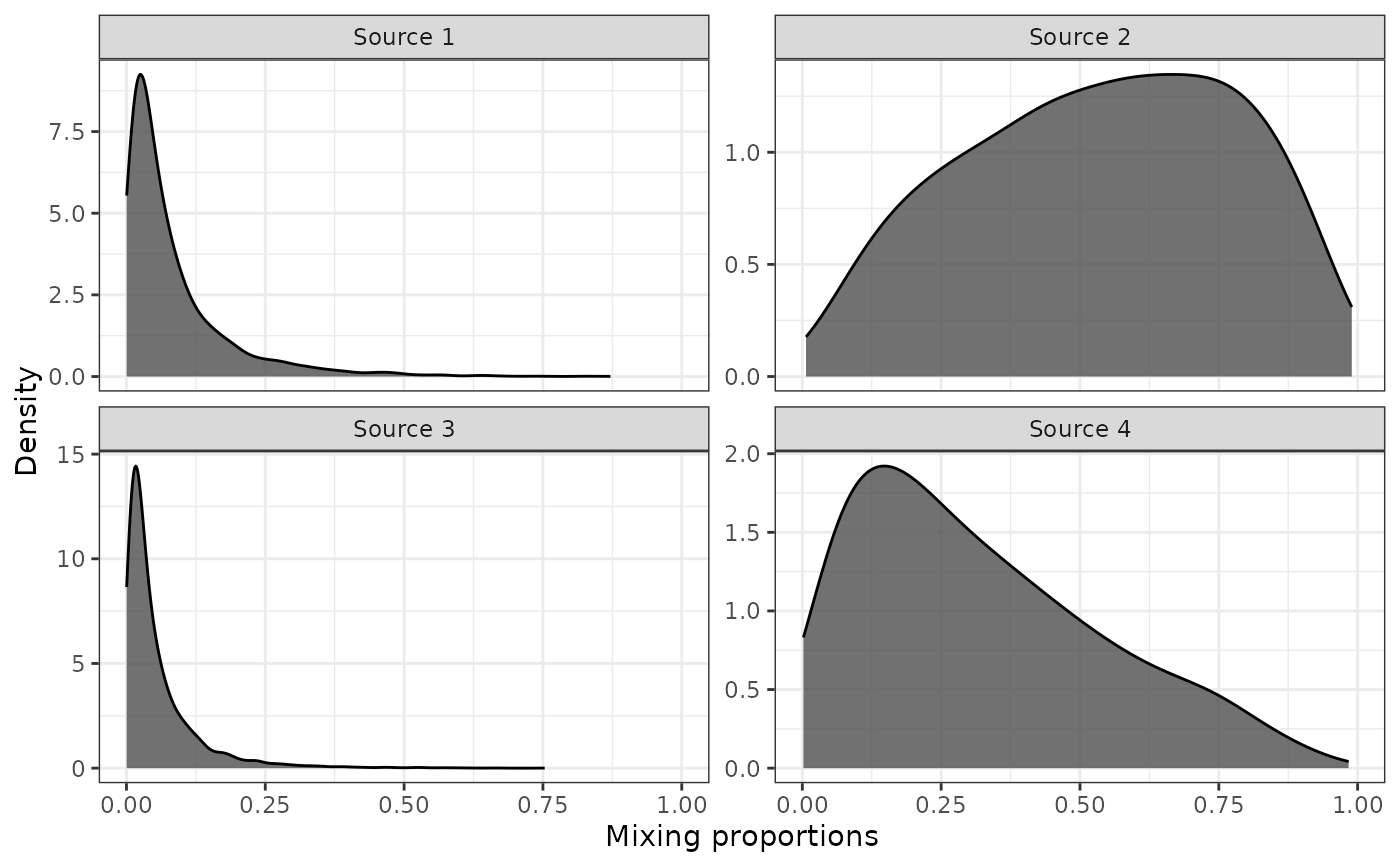
evaluate_uncertainty.RdThis function plots the expected uncertainty around each input mixing proportion given its uncertainty on the log scale.
evaluate_uncertainty(pi, ln_sigma_rho, iter = 10000, seed = 10)Arguments
- pi
A numeric vector containing mixing proportions (needs to sum to 1). If named, the function uses the names for plotting purposes.
- ln_sigma_rho
A numeric vector containing the uncertainty around
pion the log scale.- iter
Integer. The number of iterations to run the simulation for. Defaults to 10,000.
- seed
Integer. Seed for simulation reproducibility. Defaults to 10. Defaults to 10.
Value
A ggplot object representing the faceted
Details
We recognise that choosing the appropriate value for the uncertainty around data stream 2, \(\sigma_{\text{ln}\rho}\), is not trivial. Therefore, the MixMustR package offers a simple tool which plots the expected variability in mixing proportion as a function of an input vector of mixing proportions from data stream 2 (one from each source), and their respective degrees of confidence or measurement error. Although the function does not inform the user what the expected uncertainty for each source and observation should be (what has to come from expect knowledge), it does allow the user to fine tune \(\sigma_{\text{ln}\rho}\) until the appropriate variability in input mixing proportions is achieved.