Compare Mixing Proportions Between Data Streams
Source:R/internal_data.R
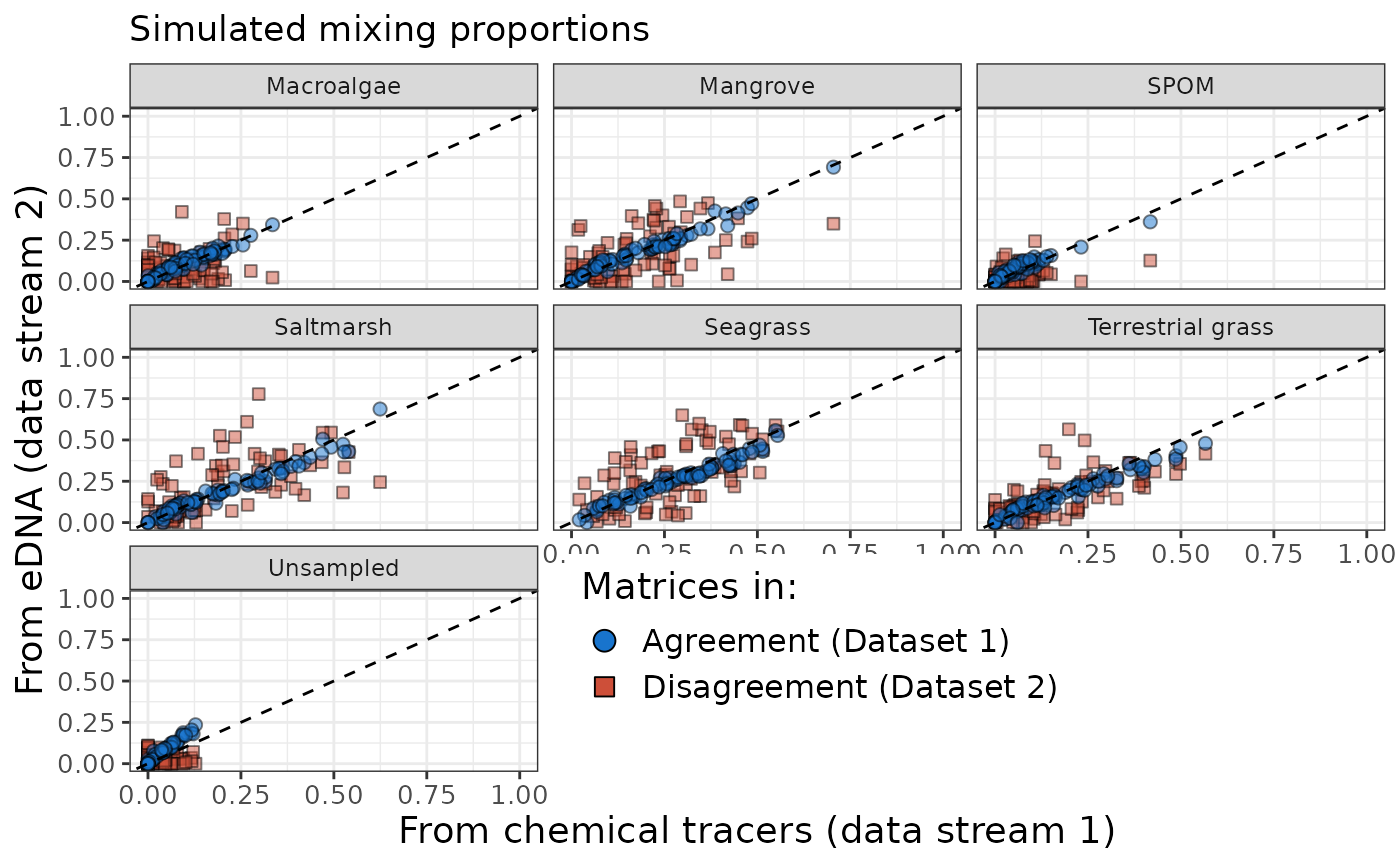
compare_mixing_proportions.RdThis function generates a plot to compare the mixing proportions between two data streams (e.g., chemical tracers and eDNA) for synthetic datasets with agreement and disagreement.
compare_mixing_proportions(synth_list_d, synth_list_c, mu_tab)Arguments
- synth_list_d
A list representing the synthetic dataset with divergent mixing proportions.
- synth_list_c
A list representing the synthetic dataset with convergent mixing proportions.
- mu_tab
A data frame containing the mean tracer signatures for each source. The first column should be named
source, and the remaining columns should contain numeric tracer values.
Value
A ggplot object visualizing the comparison of mixing proportions between the two data streams.
Details
The function compares the mixing proportions from two data streams (stream_1_props and df_stream_2)
for both divergent and convergent synthetic datasets. It reshapes and aligns the data based on the
reference order provided in mu_tab, and then creates a scatter plot with points representing
the proportions from each data stream. The plot includes facets for each source and highlights
agreement or disagreement between the datasets.