
Cookbook examples
Extracting model details
Example showcasing how to extract model details, such as the model parameter table and model specification, and more specific information from the above.
using DataFrames
using ADRIA

# Loading a dataset for a study area (a "domain")
data_pkg = "./Example_domain"
dom = ADRIA.load_domain(data_pkg, 45)

# Get current parameter table (fieldnames and their values)
param_df = ADRIA.param_table(dom)

# Get model specification with lower/upper bounds separated
model_spec = ADRIA.model_spec(dom)

# Export model specification to CSV
ADRIA.model_spec(dom, "model_spec.csv")

# Get parameter details

# Parameter names
p_names = dom.model[:fieldname]

# Current values
p_vals = dom.model[:val]

# ADRIA parameter types
p_types = dom.model[:ptype]

# Parameter bounds (for e.g., to pass into a sampler or optimizer)
# Note: ADRIA integer parameter bounds are set such that lb <= x <= u+1,
# where lb is the lower bound and u is the upper bound.
# This is because `floor(x)` is assigned with `update_params!()`.
# Instances where lb == x == u indicate uncertain parameters that
# are nevertheless assumed to be constant.
p_bounds = dom.model[:bounds]

# Component groups
p_groups = dom.model[:component]

# All of above as a DataFrame
model_spec = DataFrame(dom.model)

# Get DataFrame of parameter information for a specific sub-component (Intervention, Criteria, Coral)
ADRIA.component_params(dom.model, Intervention)
Generating and running scenarios
using ADRIA

# Loading data package
dom = ADRIA.load_domain("Example_domain", "<RCP>")

# Creating 128 scenarios based on parameter bounds using the Sobol' method
scens = ADRIA.sample(dom, 128)

# Can also use other samplers
# using Surrogates.QuasiMonteCarlo
# scens = ADRIA.sample(dom, 100, LatinHypercubeSample())

# Can also sample counterfactuals (scenarios with no interventions)
# or scenarios with guided interventions only
# s = ADRIA.sample_cf(dom, 32)
# s = ADRIA.sample_guided(dom, 32)

# Can also load previously generated scenarios
# p_df = ADRIA.load_scenarios(dom, joinpath(here, "example_scenarios.csv"))

# Batch run scenarios. Returns a ResultSet.
rs = ADRIA.run_scenarios(dom, scens, "45")

# Multiple RCPs can be specified, so long as RCP-specific data is available.
# rs = ADRIA.run_scenarios(dom, p_df, ["45", "60"])

# Single scenario run (returns NamedTuple of results for a single environmental/intervention scenario).
# See documentation for more detail.
# scenario_id = 1
# result = ADRIA.run_scenario(domain::Domain, scenario_id, param_df::DataFrameRow)

# switch_RCPs!(domain, "45")
# res1 = ADRIA.run_scenario(domain, scens[1, :])
# res2 = ADRIA.run_scenario(domain, scens[2, :])
# res3 = ADRIA.run_scenario(domain, scens[3, :], "60")  # run for a different RCP

# The location of the outputs stored on disk
@info ADRIA.store_name(rs)
# "Example_domain__RCPs45__2022-10-19_12_01_26_965"

@info ADRIA.result_location(rs)
# "[some location]/Example_domain__RCPs45__2022-10-19_12_01_26_965"

# Can also load results using a path to the stored result set.
# rs = ADRIA.load_results("path to result set")

# Specific metrics found in the `metrics` submodule.
# tac = ADRIA.metrics.total_absolute_cover(rs)
Intervention location selection
using ADRIA
using ADRIA: rank_locations

dom = ADRIA.load_domain("path to domain", "45")
scens = ADRIA.sample_site_selection(dom, 8)

# Area of coral aquaculture corals in m^2
iv_CAq_area = 962.11

# Initial coral cover matching number of criteria samples (size = (no. criteria scens, no. of sites)).
sum_cover = repeat(sum(dom.init_coral_cover; dims=1), size(scens, 1))

# Use rank_locations to get ranks
ranks = rank_locations(dom, scens, sum_cover, iv_CAq_area)
Intervention location selection - summary functions
using ADRIA
using ADRIA:
    rank_locations,
    ranks_to_frequencies,
    location_selection_frequencies,
    selection_score
using DataFrames
using Statistics, StatsBase

# Load data package
dom = ADRIA.load_domain("path to Domain files", "RCP")

# Select locations for interventions without any model runs
scens = ADRIA.sample_site_selection(dom, 8)

# Area of coral aquaculture corals in m^2
iv_CAq_area = 962.11

# Initial coral cover matching number of criteria samples
sum_cover = repeat(sum(dom.init_coral_cover; dims=1), size(scens, 1))

# Use rank_locations to get ranks
ranks = rank_locations(dom, scens, sum_cover, iv_CAq_area)

# Get frequencies with which each site is selected for each rank
rank_freq = ranks_to_frequencies(ranks[intervention = 1])

# Calculate rank aggregations
location_selection_frequency = location_selection_frequencies(ranks[intervention = 1])

# Get summed inverse rank for set of standalone location selections
sel_score = selection_score(ranks[intervention = 1])

# Use aggregation function within rank_locations to get direct output
rank_frequencies_CAq = rank_locations(
    dom, scens, sum_cover, iv_CAq_area, ranks_to_frequencies, 1
)
rank_frequencies_CAq = rank_locations(
    dom, scens, sum_cover, iv_CAq_area, location_selection_frequencies, 1
)
rank_frequencies_CAq = rank_locations(
    dom, scens, sum_cover, iv_CAq_area, selection_score, 1
)

# Example using ADRIA runs
scens = ADRIA.sample(dom, 8)
rs = ADRIA.run_scenarios(dom, scens, "45")

# Get frequencies with which each site was selected for each rank
rank_freq = ranks_to_frequencies(ADRIA.metrics.CAq_ranks(rs))

# Get selection frequencies for set of runs
selection_freq = location_selection_frequencies(rs.ranks[intervention = 1])

# Get selection frequencies over time for unguided runs only
unguided_freq = location_selection_frequencies(
    rs.iv_CAq_log[scenarios = findall(scens.guided .>= 1)]
)

# Get selection score for set of runs
sel_score = selection_score(rs.ranks[intervention = 1])

# Get selection score for locations over time
sel_score = selection_score(rs.ranks[intervention = 1]; dims=[:scenarios])
Taxonomy plot
Relative cover by taxa group over time, summarised across scenarios.
using ADRIA
using ADRIAviz

dom = ADRIA.load_domain("path/to/domain", "45")
scens = ADRIA.sample(dom, 128)
rs = ADRIA.run_scenarios(dom, scens, "45")

ADRIA.viz.taxonomy(rs)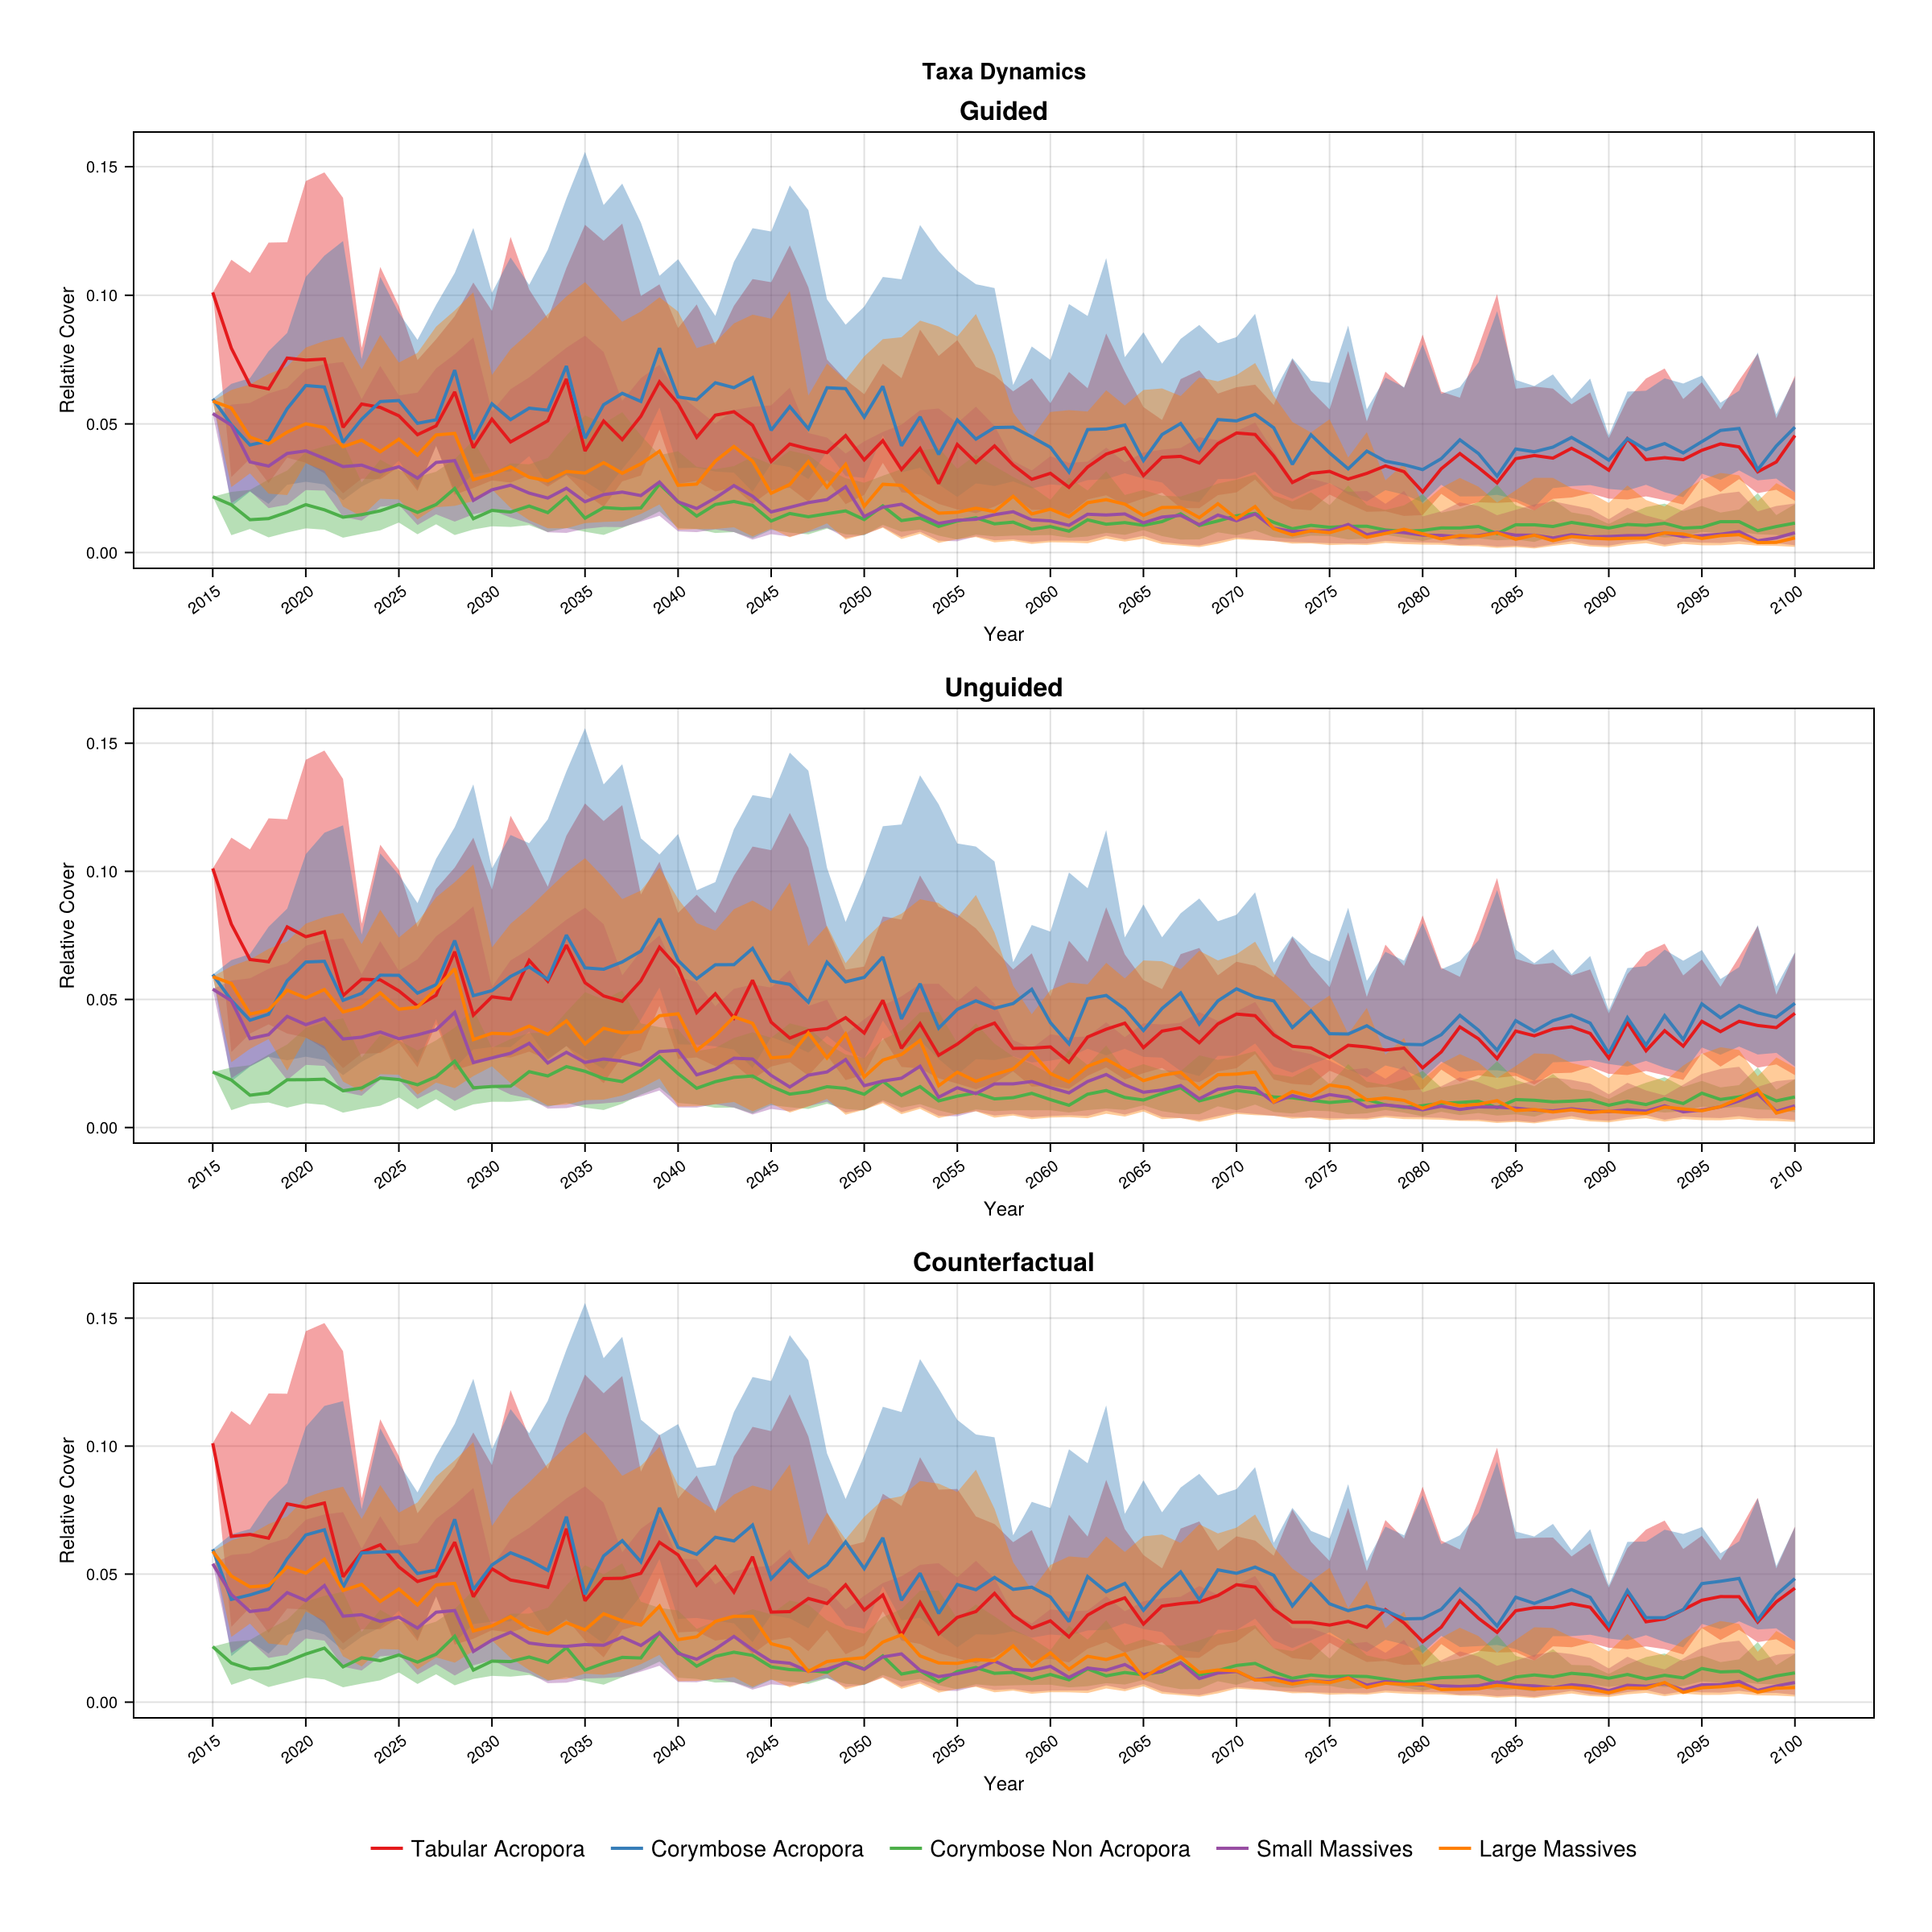
Scenarios coloured by cluster
Scenario trajectories with each scenario line coloured by its cluster membership. Useful for visually inspecting how clusters differ in trajectory shape.
using ADRIA
using ADRIAviz
using ADRIA.analysis: cluster_scenarios

dom = ADRIA.load_domain("path/to/domain", "45")
scens = ADRIA.sample(dom, 128)
rs = ADRIA.run_scenarios(dom, scens, "45")

s_tac = ADRIA.metrics.scenario_total_cover(rs)
clusters = cluster_scenarios(s_tac, 4)

ADRIA.viz.scenarios(s_tac, clusters)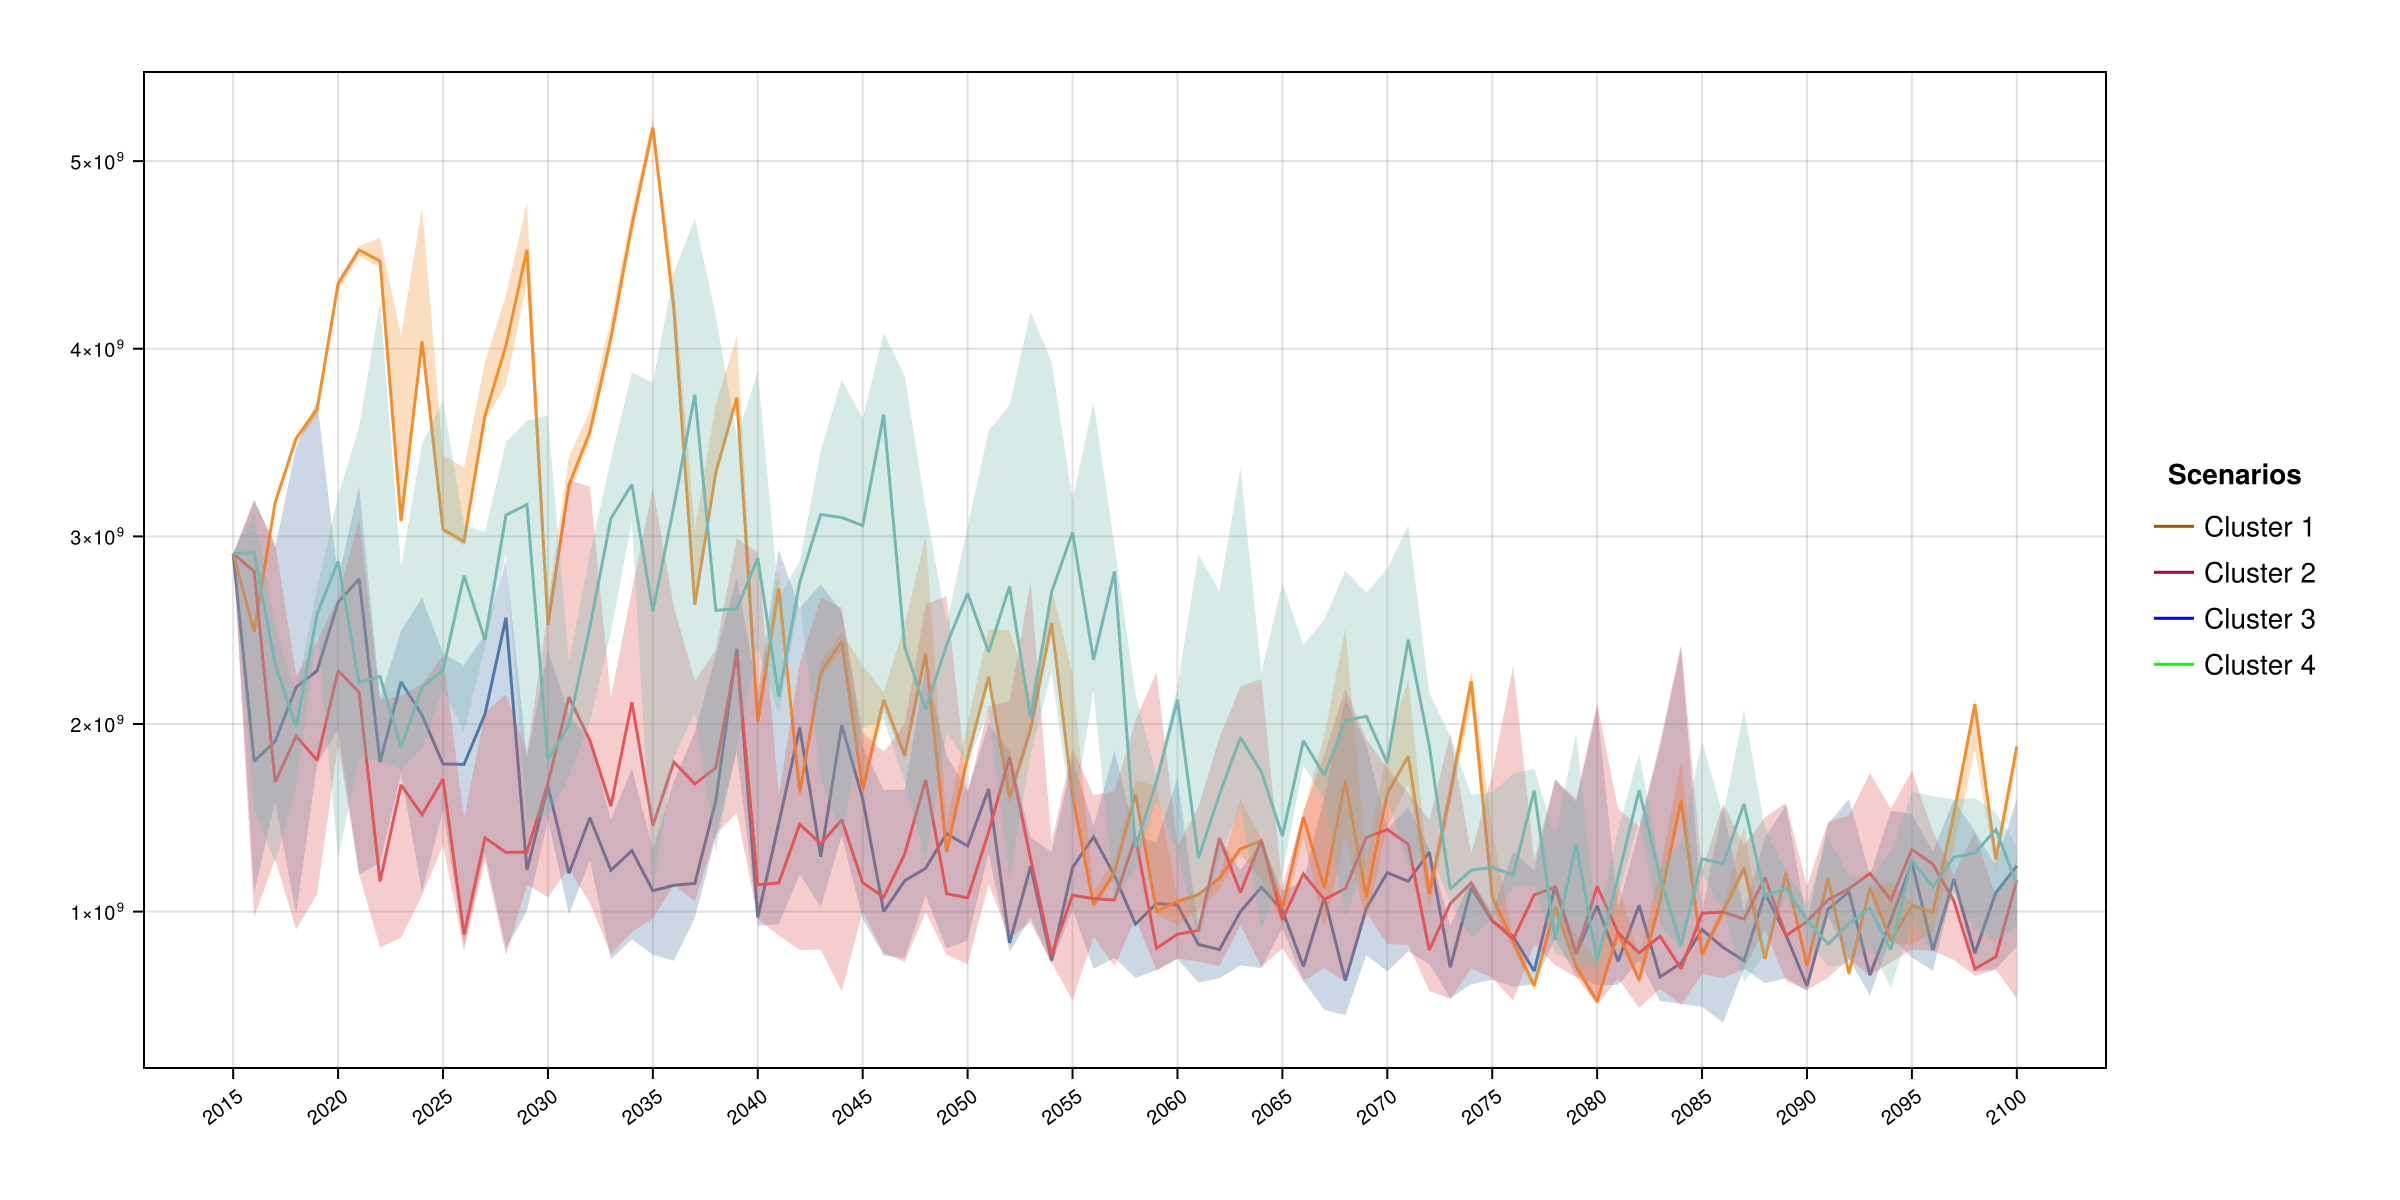
Connectivity graph
Network graph of larval connectivity between locations in the domain. Node size reflects relative connectivity strength.
using ADRIA
using ADRIAviz

dom = ADRIA.load_domain("path/to/domain", "45")

ADRIA.viz.connectivity(dom)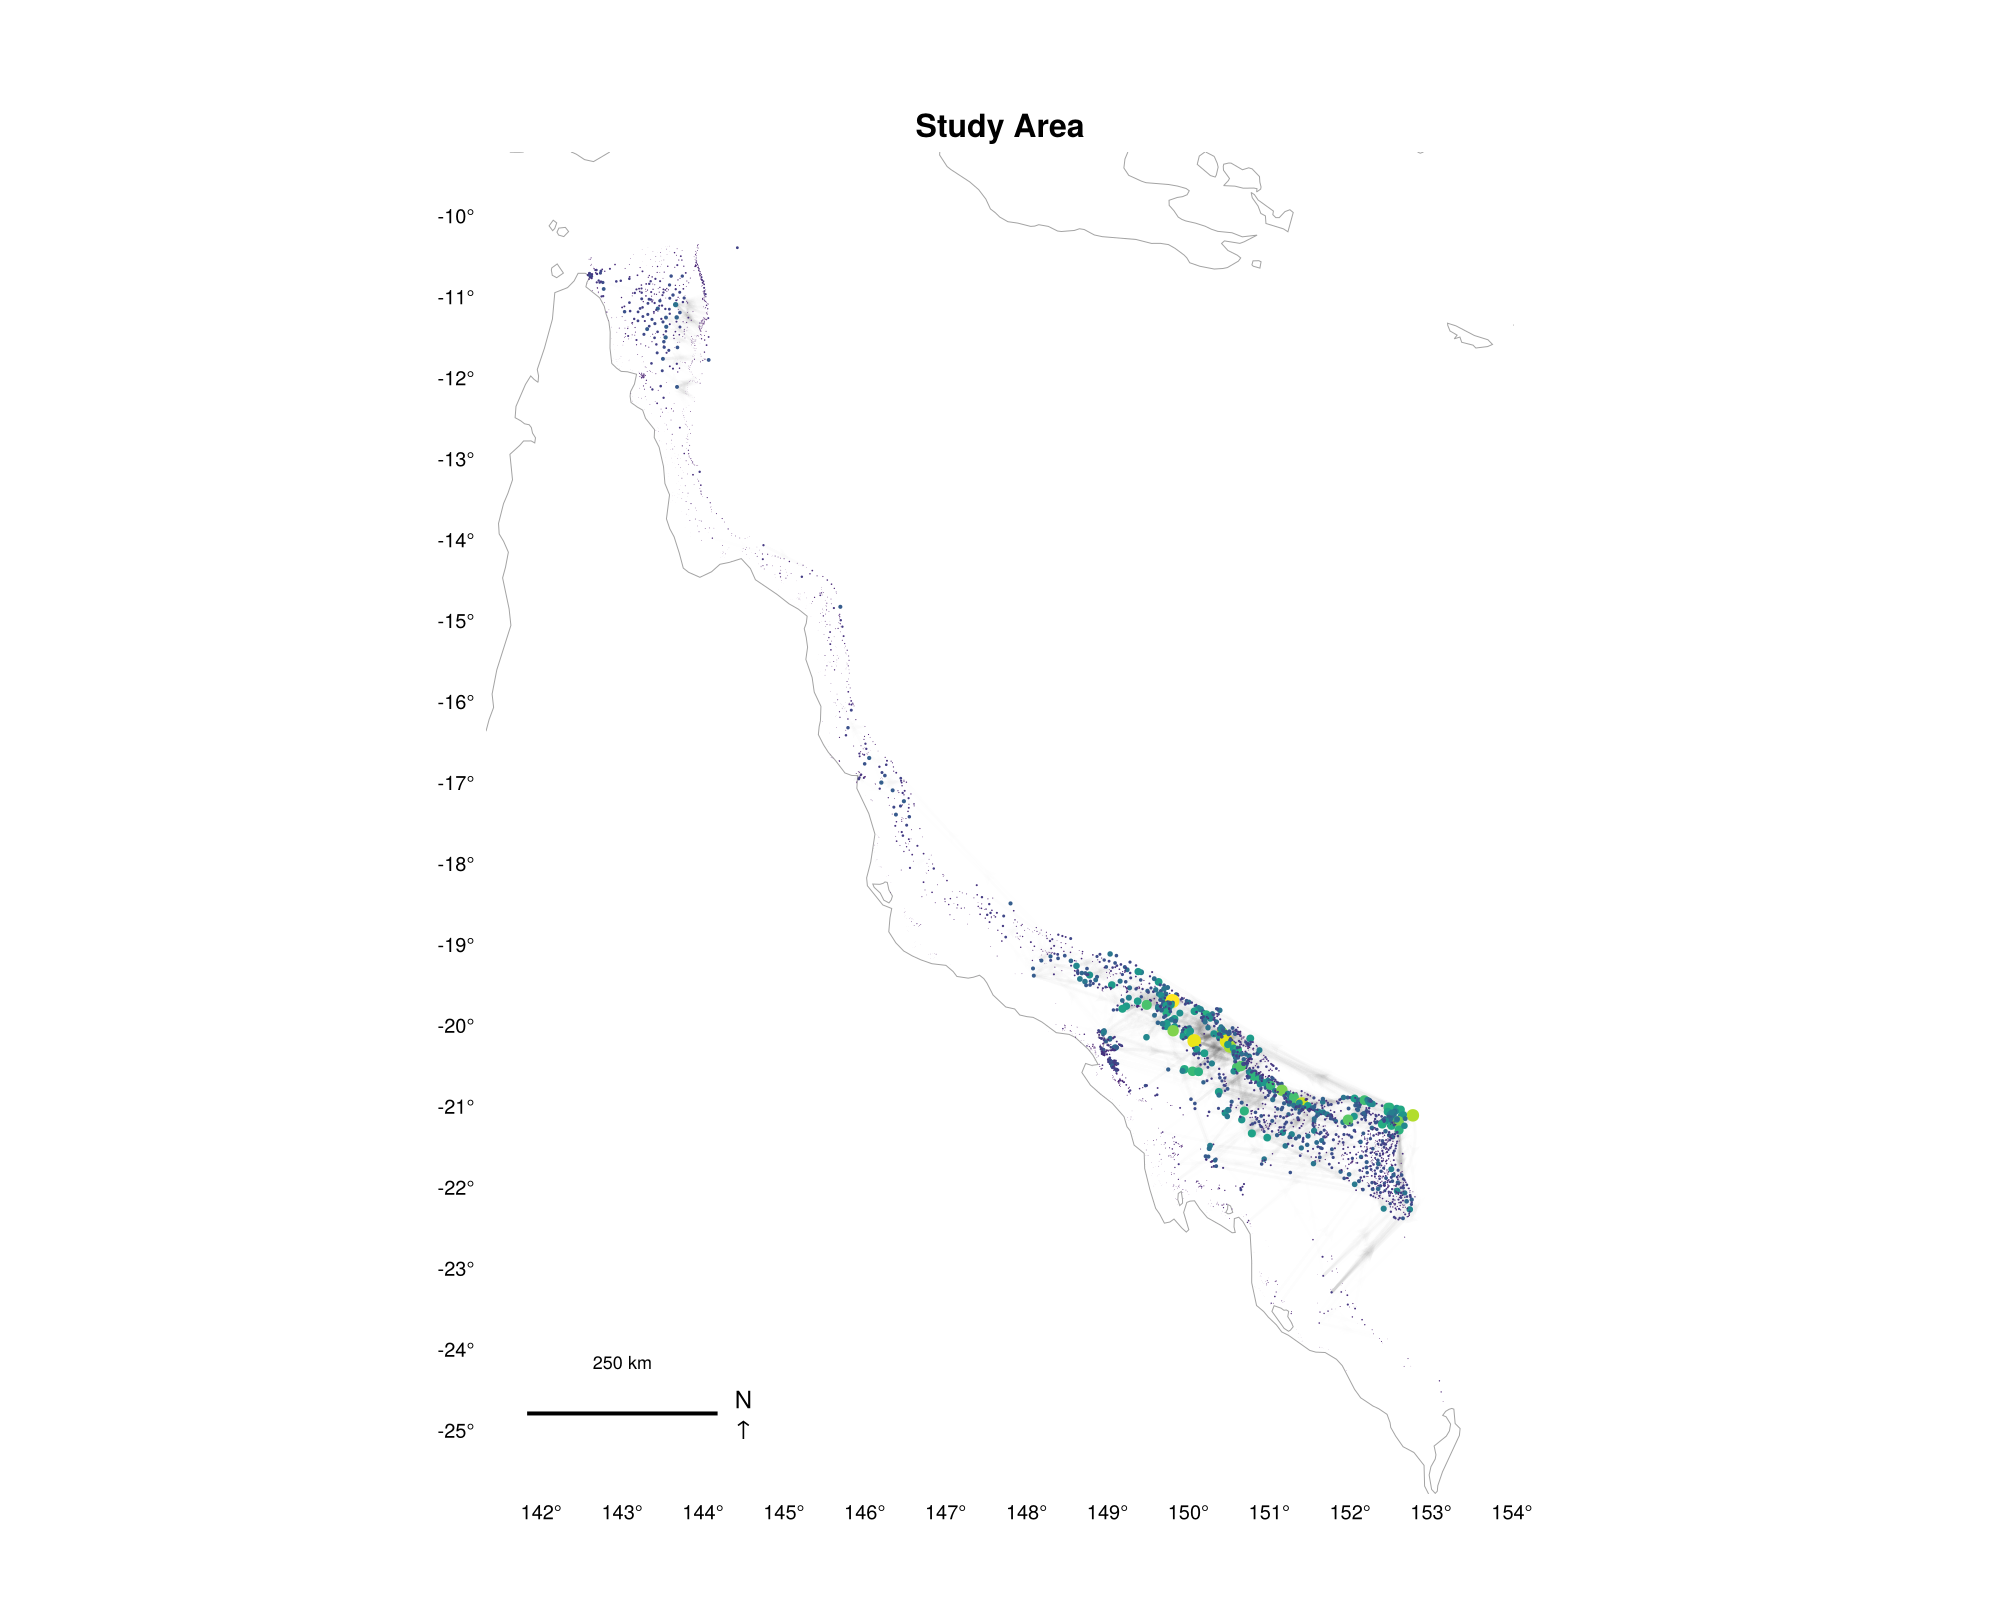
Selection frequency by intervention type
Spatial map showing how often each location was selected, shown as a panel per intervention type (coral aquaculture, fogging, shading, larval methods).
using ADRIA
using ADRIAviz

dom = ADRIA.load_domain("path/to/domain", "45")
scens = ADRIA.sample(dom, 128)
rs = ADRIA.run_scenarios(dom, scens, "45")

intervention_types = (:caq, :fog, :Shd, :lvm)
labels = String[]
freq_cols = Vector{Float64}[]
for iv in intervention_types
    freq = try
        collect(Float64, ADRIA.decision.selection_frequency(rs.ranks, iv))
    catch
        continue
    end
    any(x -> isfinite(x) && x > 0, freq) || continue
    push!(labels, titlecase(string(iv)))
    push!(freq_cols, freq)
end

freq_matrix = reduce(hcat, freq_cols)
ADRIA.viz.map(rs, freq_matrix, labels)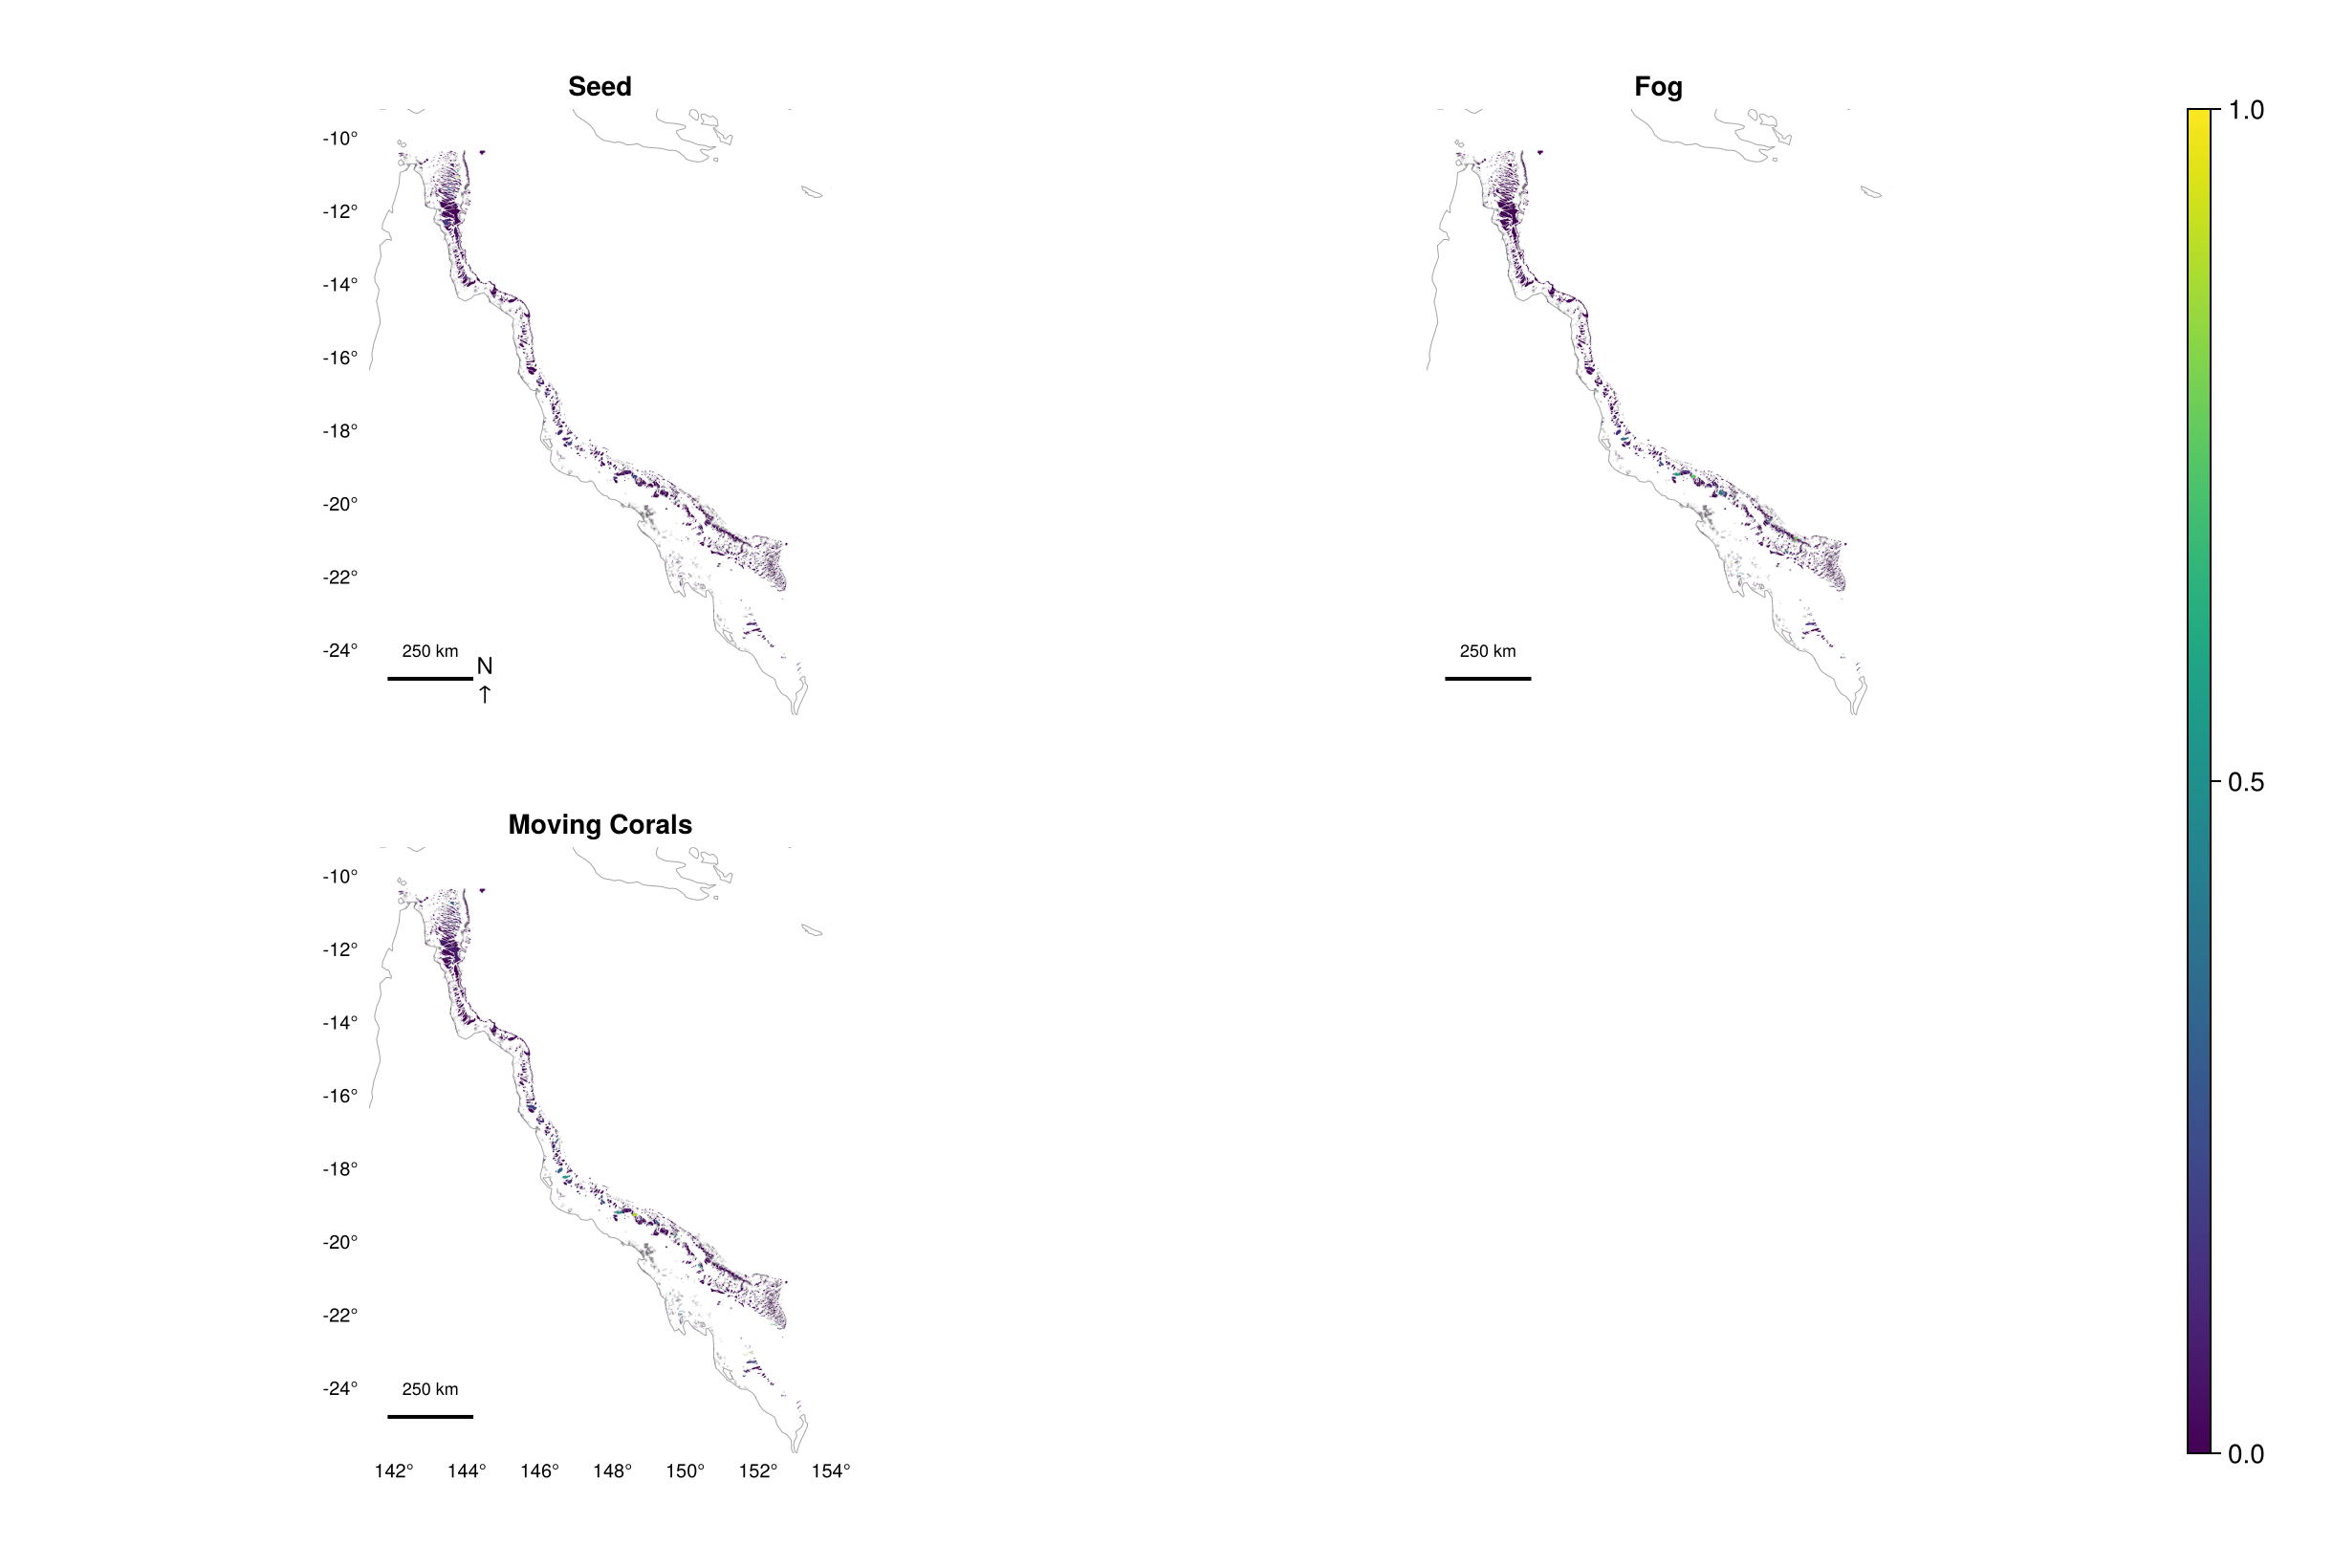
DHW scenario
Degree heating weeks over time for a single environmental scenario.
using ADRIA
using ADRIAviz

dom = ADRIA.load_domain("path/to/domain", "45")

# Show DHW projections for environmental scenario 1
ADRIA.viz.dhw_scenario(dom, 1)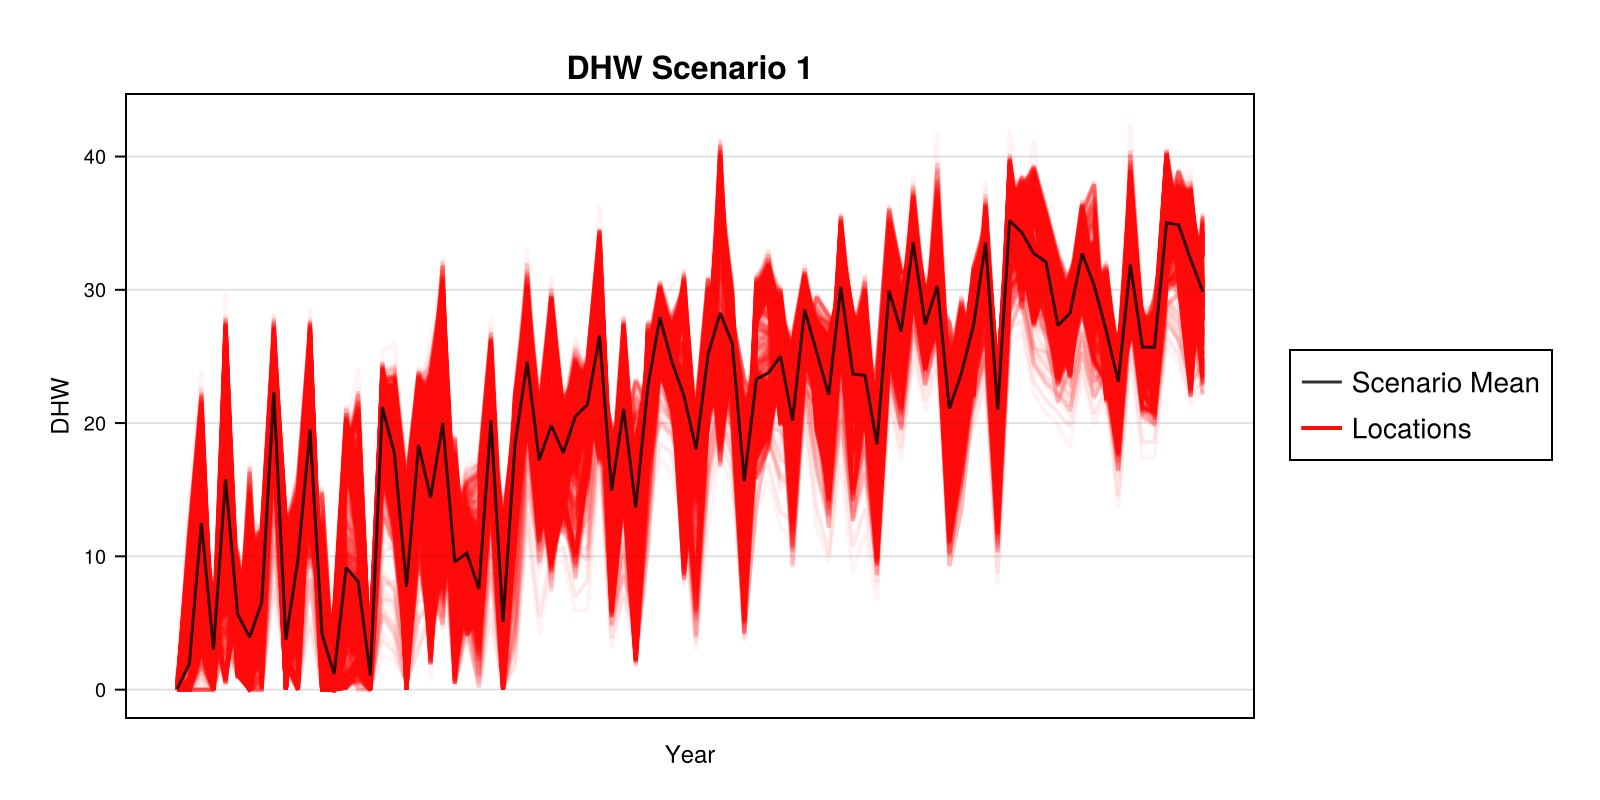
DHW scenarios (all)
Summary of degree heating weeks across all environmental scenarios, showing the ensemble range and median.
using ADRIA
using ADRIAviz

dom = ADRIA.load_domain("path/to/domain", "45")

ADRIA.viz.dhw_scenarios(dom)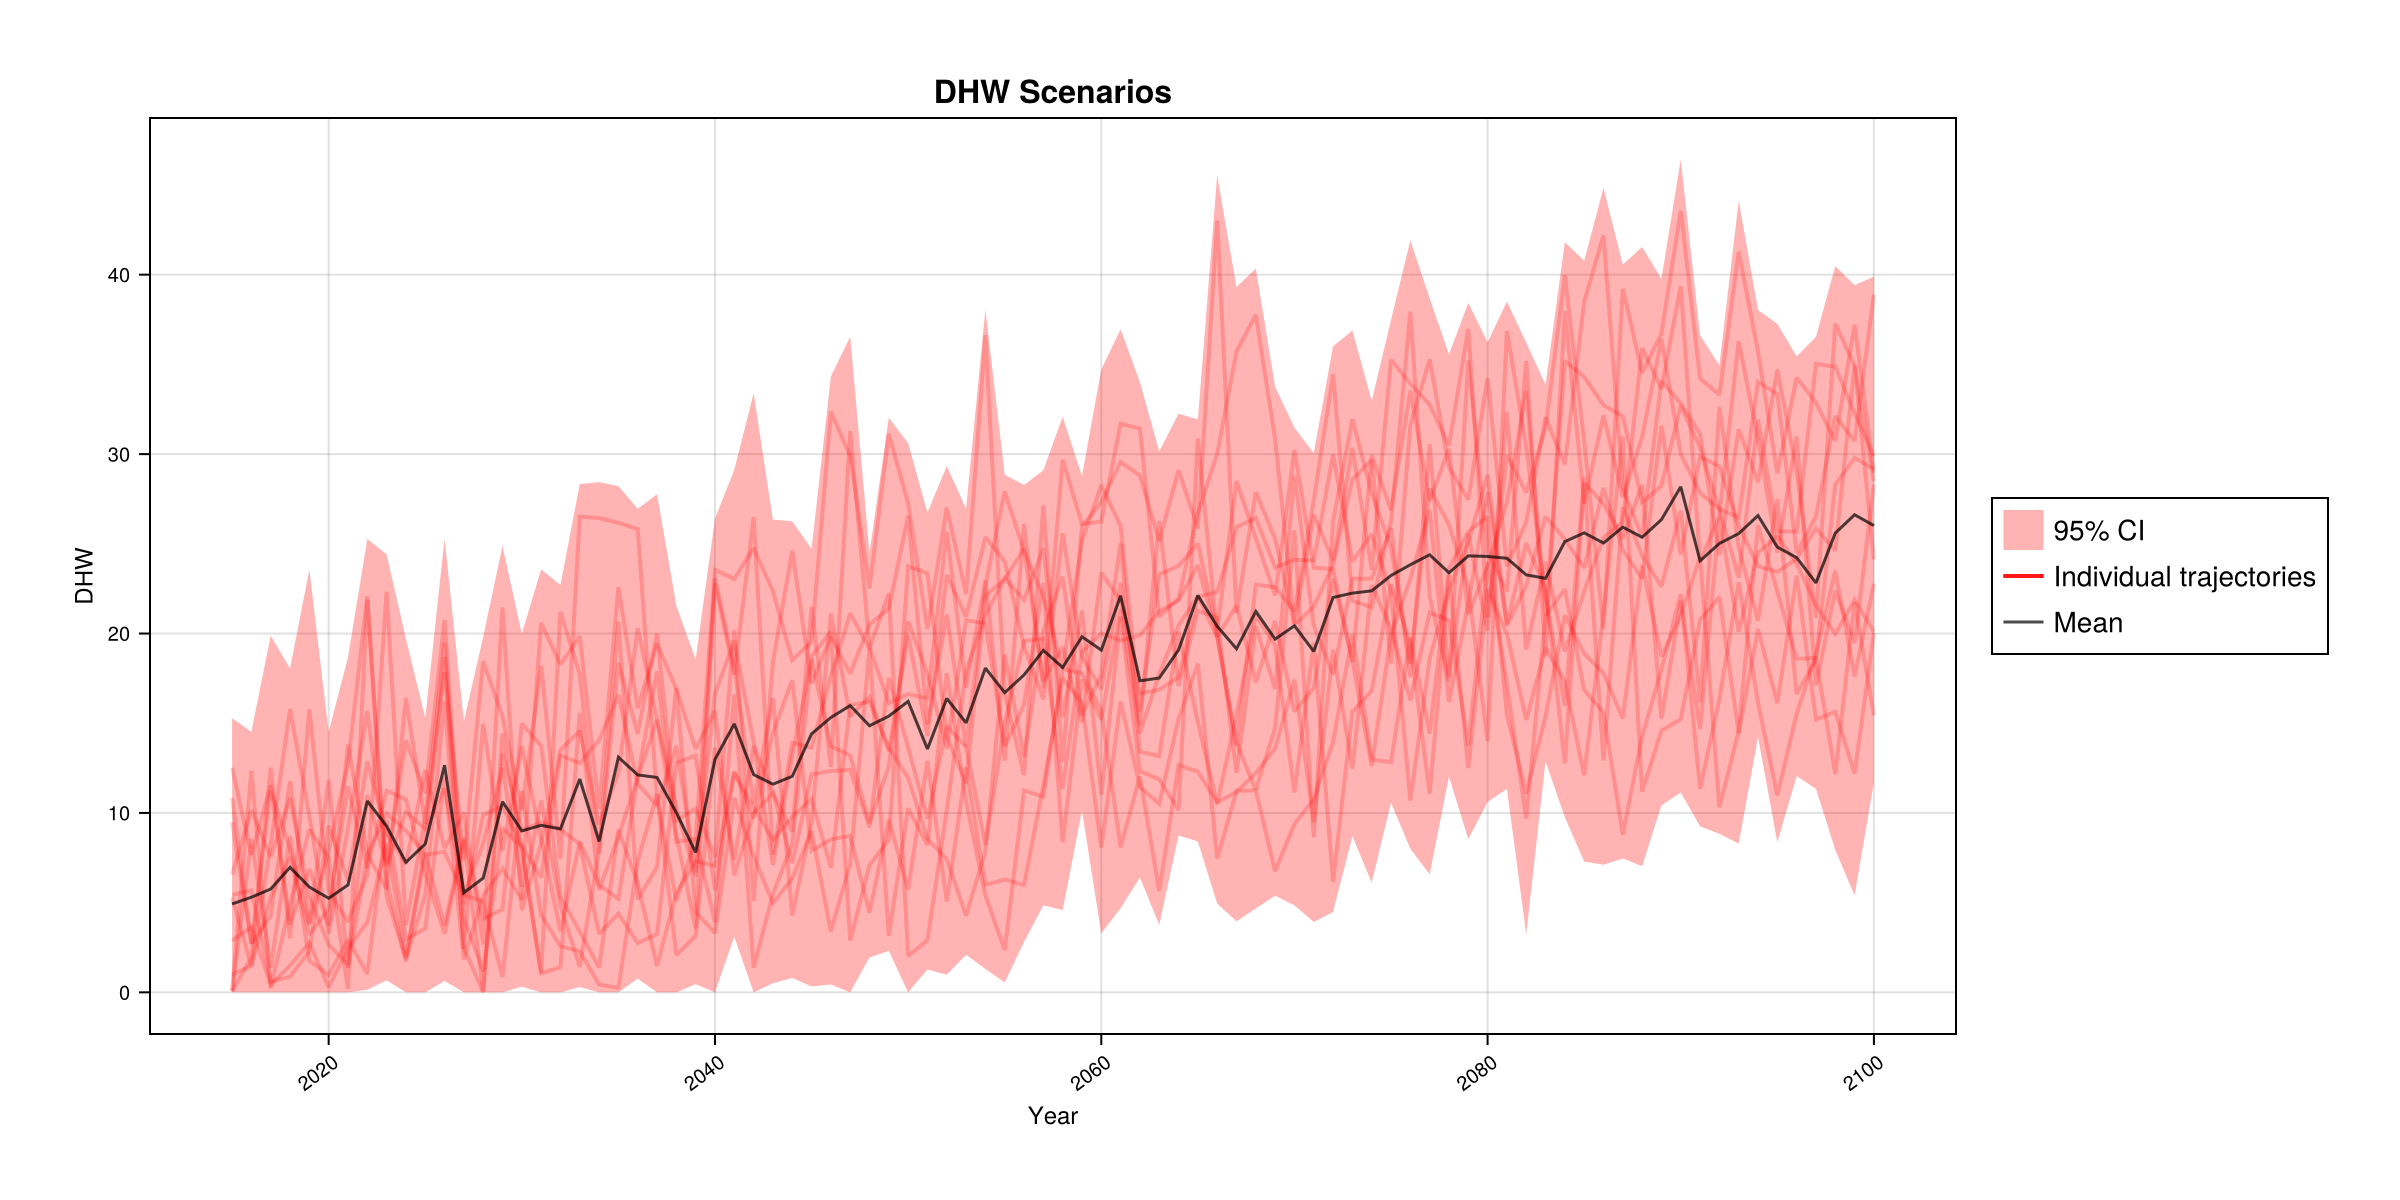
Cyclone scenario
Cyclone disturbance severity over time for a single environmental scenario.
using ADRIA
using ADRIAviz

dom = ADRIA.load_domain("path/to/domain", "45")

# Show cyclone disturbance for environmental scenario 1
ADRIA.viz.cyclone_scenario(dom, 1)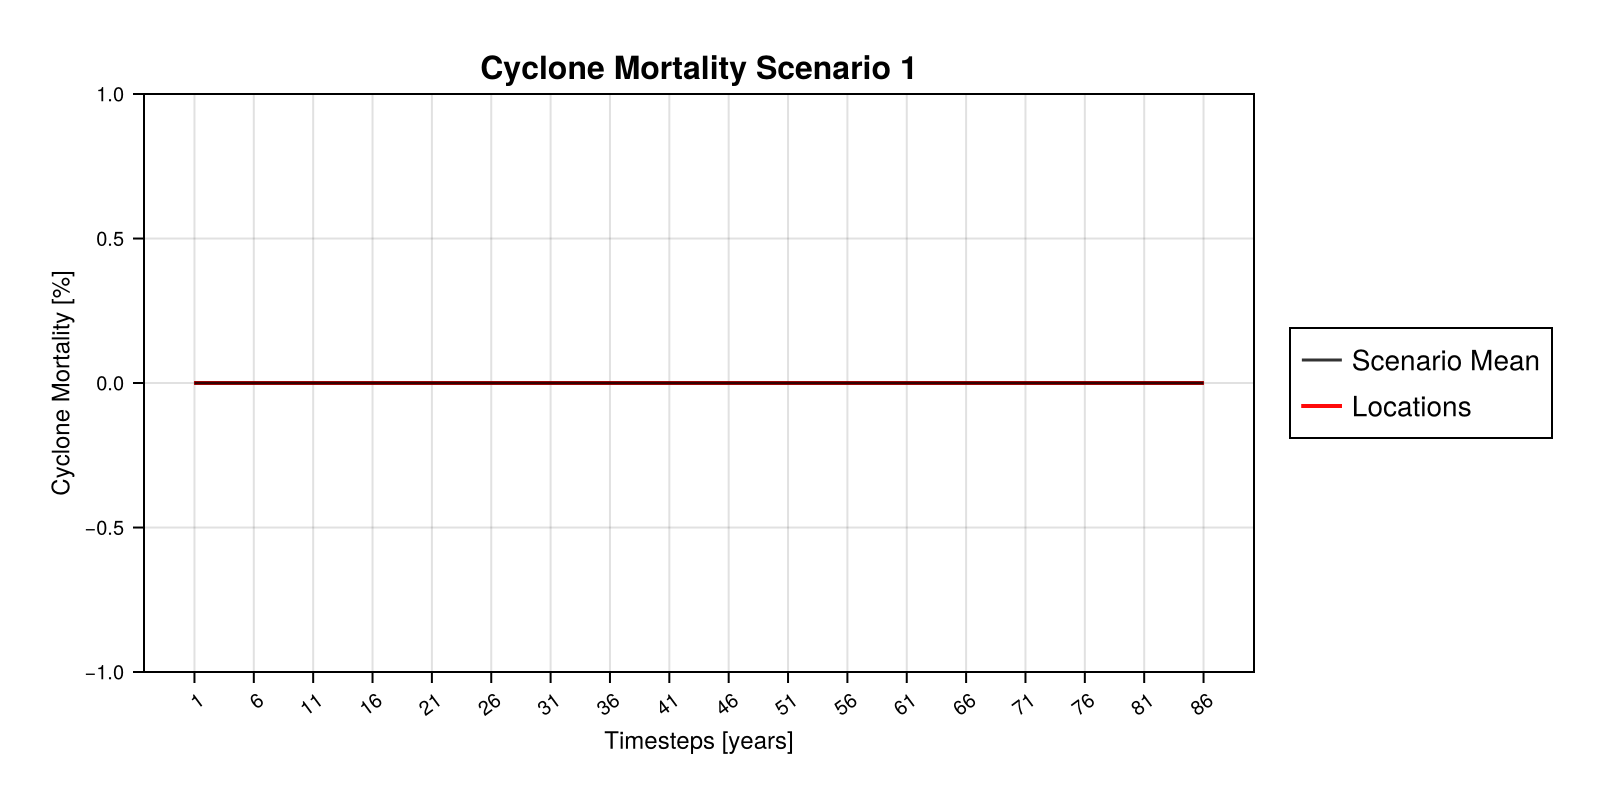
This page was generated using Literate.jl.